Process Monitoring
Unduh
Mode fokus
Ukuran font
Feature Background
In general scenarios, client applications require not only overall monitoring information of the database instance but also process monitoring information within the instance to assess business health and make further business logic decisions. Typically, in SaaS scenarios, a tenant of a user exclusively uses a database within an instance. By monitoring the resource usage associated with the processes connected to the database, the business side can further evaluate the tenant's current health status and other conditions.
Preparing the Environment
The process monitoring feature is provided by the
tencentdb_system_stat extension. You must create this extension in the target database before use.1. Create the extension:
postgres=> CREATE EXTENSION IF NOT EXISTS tencentdb_system_stat;CREATE EXTENSION
2. Verify that the extension is installed:
postgres=> SELECT extname, extversion FROM pg_extension WHERE extname = 'tencentdb_system_stat';extname | extversion--------------------------+------------tencentdb_system_stat | 1.1(1 row)
Viewing Process Monitoring
Process monitoring data is exposed externally through the system view
tencentdb_process_system_usage. This view displays the CPU utilization and memory usage of each process, with one row per process.Querying Monitoring Data for All Processes
postgres=> SELECT * FROM tencentdb_process_system_usage;pid | usename | datname | backend_type | query | cpu_usage | memory_bytes-------+----------+----------+------------------------------+----------------------------------------------------+-----------+--------------52962 | | | walwriter | | 0 | 757350452964 | postgres | | logical replication launcher | | 0 | 613580852957 | | | io worker | | 0 | 577126452960 | | | background writer | | 0 | 589004852959 | | | checkpointer | | 0 | 2397798452956 | | | io worker | | 0 | 1261158452958 | | | io worker | | 0 | 423526426706 | root | postgres | client backend | SELECT * FROM tencentdb_process_system_usage; | 0 | 17186816(8 rows)
View Field Descriptions
Field Name | Type | Description |
pid | integer | Process ID |
usename | name | Username. |
datname | name | Database name |
backend_type | text | Process type, such as client backend, autovacuum worker, walwriter, checkpointer, background writer, logical replication launcher, and so on. |
query | text | The SQL statement currently being executed (empty for background processes). |
cpu_usage | real | CPU utilization during the current sampling period, ranging from 0.0 to 1.0 (that is, 0% to 100%). |
memory_bytes | bigint | Memory usage (RSS) during the current sampling period, in bytes. |
Note:
cpu_usage represents the CPU utilization at the sampling instant. It is the ratio of the CPU time consumed by the process between two sampling points to the total system CPU time, based on a single CPU core. When a single core is fully loaded, cpu_usage = 1.0. In multi-core parallel scenarios, it may be greater than 1.0.
memory_bytes represents the process's RSS (Resident Set Size), which is the total number of pages that the process actually resides in physical memory. This total includes shared memory (such as shared_buffers) but excludes swap.
Each query on the view blocks for approximately sampling_interval milliseconds to complete the calculation of the difference between two samples. The default value is about 1 second.
Filtering Processes by Condition
You can use standard SQL filter criteria to view the subset you are interested in.
Sort by CPU utilization to locate processes with high CPU consumption:
postgres=> SELECT pid, usename, datname, backend_type, cpu_usage,pg_size_pretty(memory_bytes) AS memoryFROM tencentdb_process_system_usageORDER BY cpu_usage DESCLIMIT 5;pid | usename | datname | backend_type | cpu_usage | memory---------+----------+----------+------------------------------+-----------+----------52962 | | | walwriter | 0 | 7396 kB52959 | | | checkpointer | 0 | 22 MB26706 | root | postgres | client backend | 0 | 17 MB52956 | | | io worker | 0 | 12 MB52964 | postgres | | logical replication launcher | 0 | 5992 kB(5 rows)
Sort by memory usage to locate processes with high memory consumption:
postgres=> SELECT pid, usename, datname, backend_type,pg_size_pretty(memory_bytes) AS memory, cpu_usageFROM tencentdb_process_system_usageORDER BY memory_bytes DESCLIMIT 5;pid | usename | datname | backend_type | memory | cpu_usage---------+----------+----------+------------------------------+----------+-----------52959 | | | checkpointer | 22 MB | 026706 | root | postgres | client backend | 17 MB | 052956 | | | io worker | 12 MB | 052962 | | | walwriter | 7396 kB | 052964 | postgres | | logical replication launcher | 5992 kB | 0(5 rows)
Group statistics by process type:
postgres=> SELECT backend_type, count(*) AS cntFROM tencentdb_process_system_usageGROUP BY backend_typeORDER BY cnt DESC;backend_type | cnt------------------------------+-----io worker | 3walwriter | 1autovacuum launcher | 1client backend | 1background writer | 1checkpointer | 1logical replication launcher | 1(7 rows)
Filter processes for a specific tenant by database name:
postgres=> SELECT pid, usename, backend_type, cpu_usage,pg_size_pretty(memory_bytes) AS memory,substring(query, 1, 60) AS query_previewFROM tencentdb_process_system_usageWHERE datname = 'your_database';pid | usename | datname | backend_type | cpu_usage | memory | query_preview-----+---------+---------+--------------+-----------+--------+---------------(0 rows)
Parameter Description
The
tencentdb_system_stat extension provides the following parameters to control sampling behavior. This parameter is at the sighup level. After being modified, it must take effect through the console. It cannot be modified using the SET command within an SQL session.tencentdb_system_stat.sampling_interval
Attribute | Value |
Description | CPU utilization sampling interval |
Type | integer |
Unit | Millisecond (ms) |
Default | 1000 |
Value Range | 100 ~ 2147483 |
Note:
Each time you query the
tencentdb_process_system_usage view, the kernel performs two CPU time samples for each process. The interval between these two samples is the duration specified by this parameter. CPU utilization is calculated by dividing the difference between the two samples by the sampling interval. A shorter interval makes the sampling results more reflective of the instantaneous load and reduces the query's own wait time. A longer interval results in smoother sampling data but increases the query duration accordingly. For latency-sensitive scenarios, you can appropriately reduce this value.Modification Method: Log in to the Tencent Cloud console, navigate to TencentDB for PostgreSQL > Instance Management > Parameter Settings, search for the parameter
tencentdb_system_stat.sampling_interval, modify it to the target value, and save the changes. For detailed operations, see Setting Instance Parameters.Scenarios
Tenant Load Analysis in SaaS Multi-Tenant Scenarios
In a SaaS multi-tenant architecture, where different tenants connect to different databases, you can assess each tenant's resource consumption by filtering and aggregating CPU and memory metrics by
datname:postgres=> SELECT datname, count(*) AS connection_count,sum(cpu_usage) AS total_cpu,pg_size_pretty(sum(memory_bytes)::bigint) AS total_memoryFROM tencentdb_process_system_usageWHERE datname IS NOT NULLGROUP BY datnameORDER BY sum(memory_bytes) DESC;
Locating Session Resource Consumption for Slow Queries
By combining the
query field, you can quickly identify which session the currently executing SQL corresponds to and how much CPU and memory it consumes:postgres=> SELECT pid, usename, datname, cpu_usage,pg_size_pretty(memory_bytes) AS memory,substring(query, 1, 100) AS query_previewFROM tencentdb_process_system_usageWHERE query IS NOT NULL AND query <> ''ORDER BY memory_bytes DESC;
FAQs
Q: Why Is There a 1-Second Delay When a View Is Queried?
CPU utilization is calculated from the difference between two samples. The wait time between these two samples is determined by the
tencentdb_system_stat.sampling_interval parameter (default: 1000 ms). This is normal behavior. If you are sensitive to latency, you can reduce this parameter. However, an excessively small sampling interval reduces the precision of the CPU utilization calculation.Q: Why Are the usename, datname Fields Empty for Some Processes?
The
tencentdb_process_system_usage view associates process information through an inner join with pg_stat_activity. If A process is not present in pg_stat_activity (such as system background processes like walwriter and checkpointer), the corresponding fields in this view will be empty. To include all processes, use the tencentdb_process_system_usage_all view.Q: Does memory_bytes Include Shared Memory (shared_buffers)?
Yes, it does.
memory_bytes represents the process's RSS, which includes all resident physical memory pages mapped by the process, encompassing shared memory segments such as the PostgreSQL shared buffers.Q: Why Are Some Processes Not Monitored?
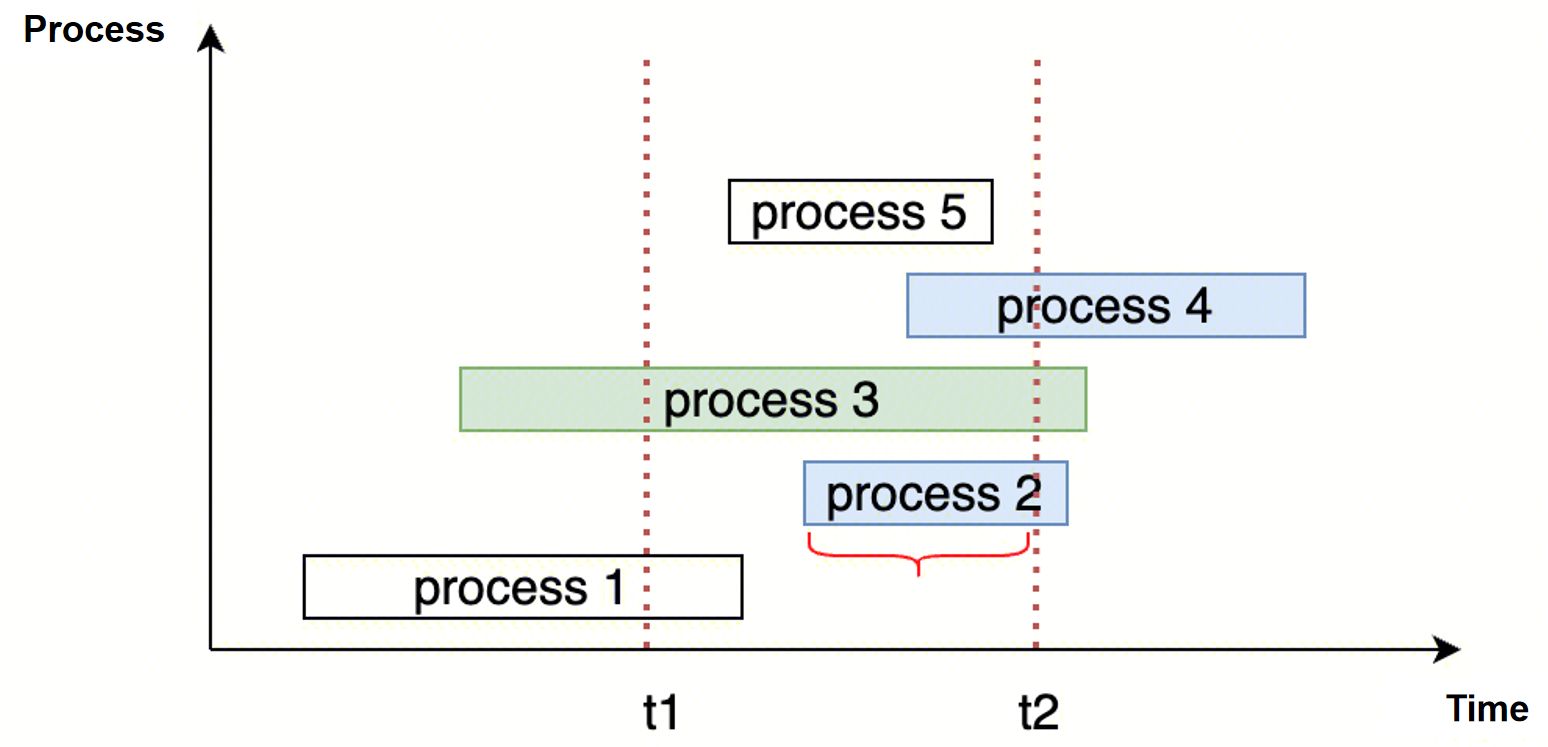
During A sampling period, only processes that are still alive at the end of the sampling are counted. As shown in the following diagram, Process 1 and Process 5 are not counted.
Bantuan dan Dukungan
Apakah halaman ini membantu?
Anda juga dapat Menghubungi Penjualan atau Mengirimkan Tiket untuk meminta bantuan.
masukan