2. On the left sidebar, select Data Processing > Scheduled SQL analysis to view the following information:
Basic task information: View the task's name, ID, source log topic, target log topic, creation time, and last modified time.
Task name, task status, task ID, task creation time, and last modified time.
Source log topic, target log topic, and service log switch.
Scheduling cycle, scheduling scope, SQL time window, and execution statement.
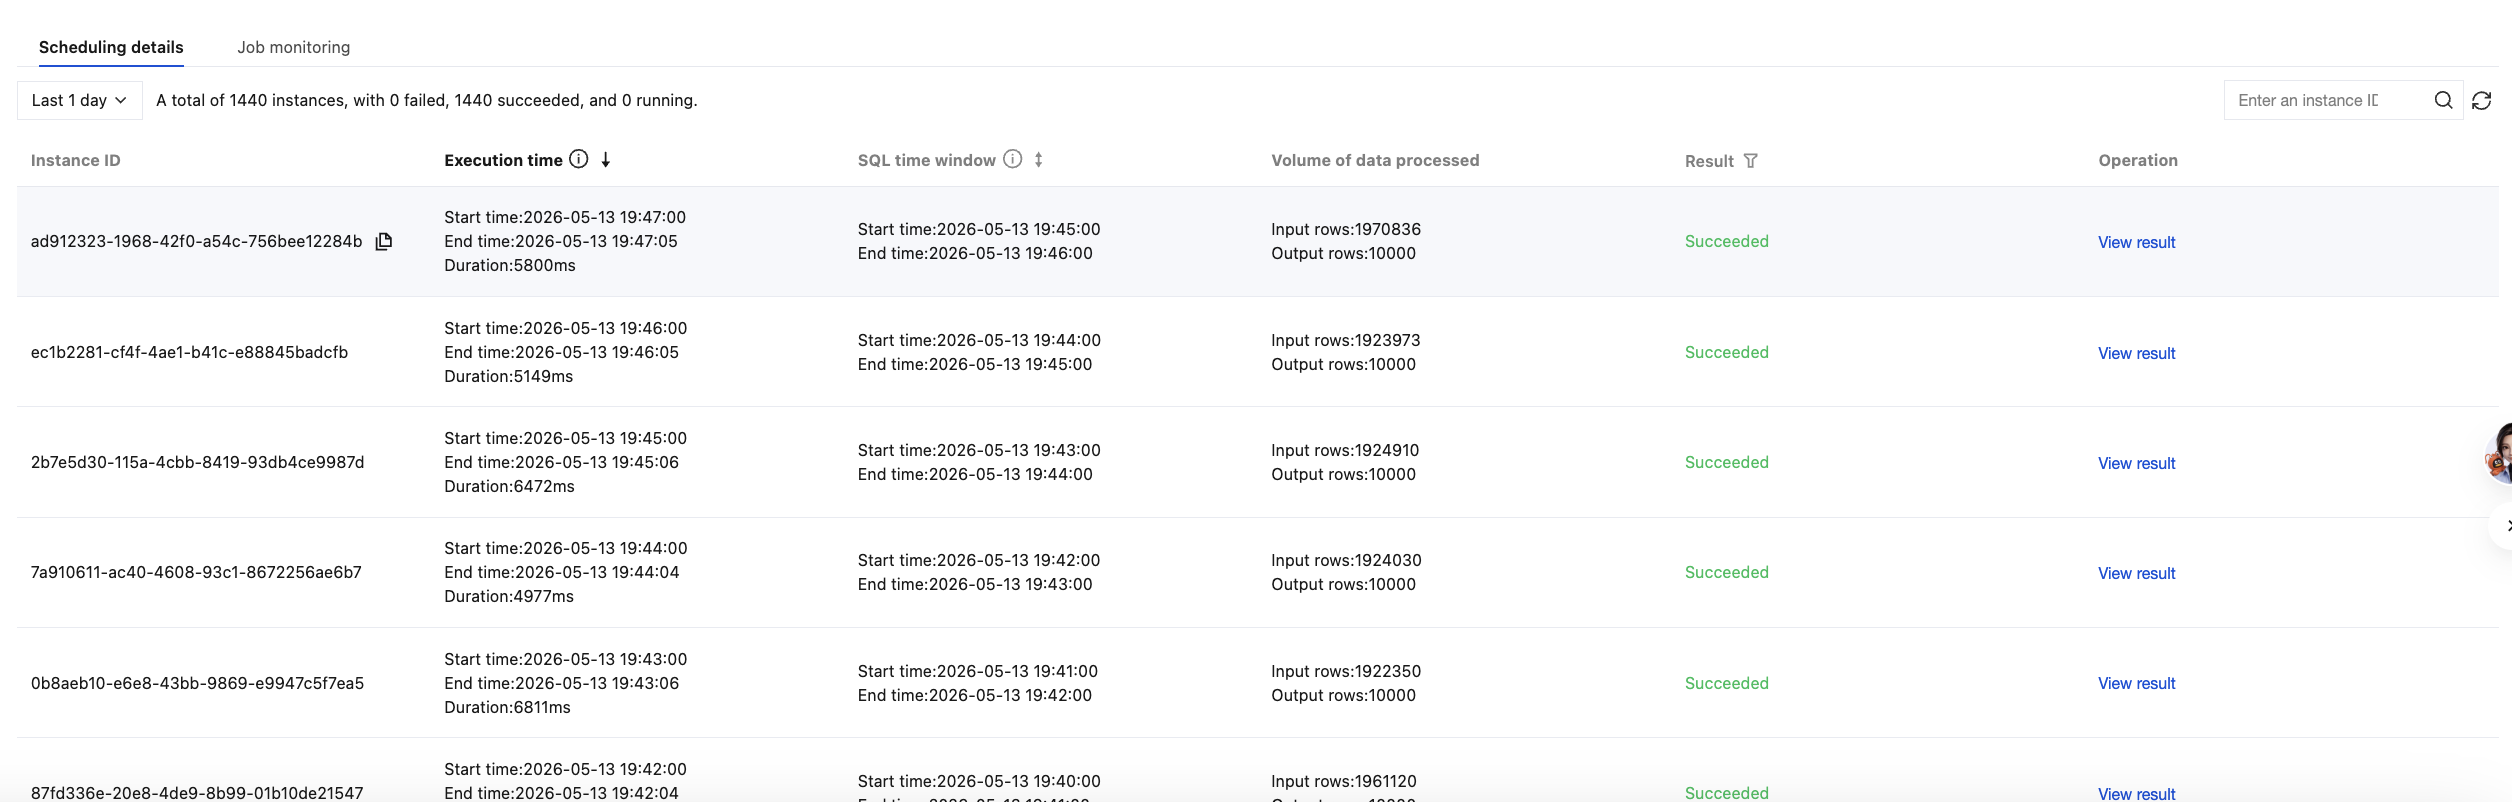
Scheduling details
Task monitoring
Scheduling details: instance ID of each SQL query, execution time of SQL query, SQL time window, processed data volume, and scheduling results.
Note:
SQL execution time: For SQL queries with failed scheduling results, the end time in the execution time is the time of the last retry, which may differ significantly from the start time because queries are retried.
Note:
Enable the service log switch in your scheduled SQL task. Otherwise, you cannot use the Add to Monitoring Alarm feature described below and can only view monitoring data.
Adding an Alarm to a Monitoring Item:
In the upper-right corner of the monitoring chart, click the Add to Monitoring Alarm icon to add monitoring metrics to your alarms. For example, you can configure SQL task analysis scheduling latency and SQL analysis duration as your monitoring alarm items.
Description of monitoring metrics:
Monitoring Chart Name
Unit
Monitoring Metric
Processed log volume
Rows
Enter the number of rows.
Output the number of rows.
Number of rows that failed to be written to the target topic.
Number of rows successfully written to the target topic.
SQL analysis duration
Millisecond/Second
Time of writing the result of a single SQL analysis (query) to the target topic - the analysis start time.
For example: The time when the result of an SQL analysis (query) is written to the target topic is 15:01:00.900, and the analysis start time (actual scheduling time) is 15:01:00.300. Therefore, that SQL analysis takes 600 milliseconds in total.
SQL analysis scheduling delay
Millisecond/Second
Delay of a single SQL analysis scheduling.
For example: The SQL analysis configured by the user is scheduled to run once per minute. Assuming that an SQL analysis (query) is scheduled to run at 15:01:00 as planned, but the actual scheduling time is 15:01:00.100, then the scheduling delay is 100 milliseconds.
SQL analysis result
Counts
Statistics of SQL analysis results.
The results of a scheduled SQL analysis include the following types: success, syntax error, query timeout, internal error, and concurrent limit exceeded.
For example: If you select to query data for 1 day in the upper-right corner, then the step size of the time axis is 15 minutes. If your scheduled SQL task has a scheduling period of 1 minute, meaning it is scheduled to run once per minute, and assuming all schedules are successful, then the analysis result is 15 successes.