In the past, it was not easy for users to troubleshoot Tencent Kubernetes Engine (TKE) problems. A Kubernetes cluster in a production environment is usually a very complex system. The bottom layer accommodates a variety of heterogeneous hosts, networks, storage devices, and other cloud infrastructure. The upper layer carries a large amount of application load. In the middle, various native components (e.g., Scheduler and Kubelet) and third-party components (e.g., various operators) run to manage and schedule infrastructure and applications. In addition, personnel with different roles frequently deploy applications, add nodes, and perform other operations on the cluster. Therefore, in the cluster OPS scenario, users often encounter the following problems:
An application in the cluster was deleted. Who did it?
The load of apiserver suddenly becomes high and a large number of access failures occur. What happened in the cluster?
Cluster nodes are cordoned off. Who did it and when did it happen?
Through this practice, you will gain a detailed understanding of the following content:
The out-of-the-box cluster audit analysis dashboard includes analytical boards such as TKE Operation Type Distribution, Operation Status Code Distribution, and Sensitive Operation Users.
2. Click Cloud Insight in the left navigation bar to go to the Cloud Insight page.
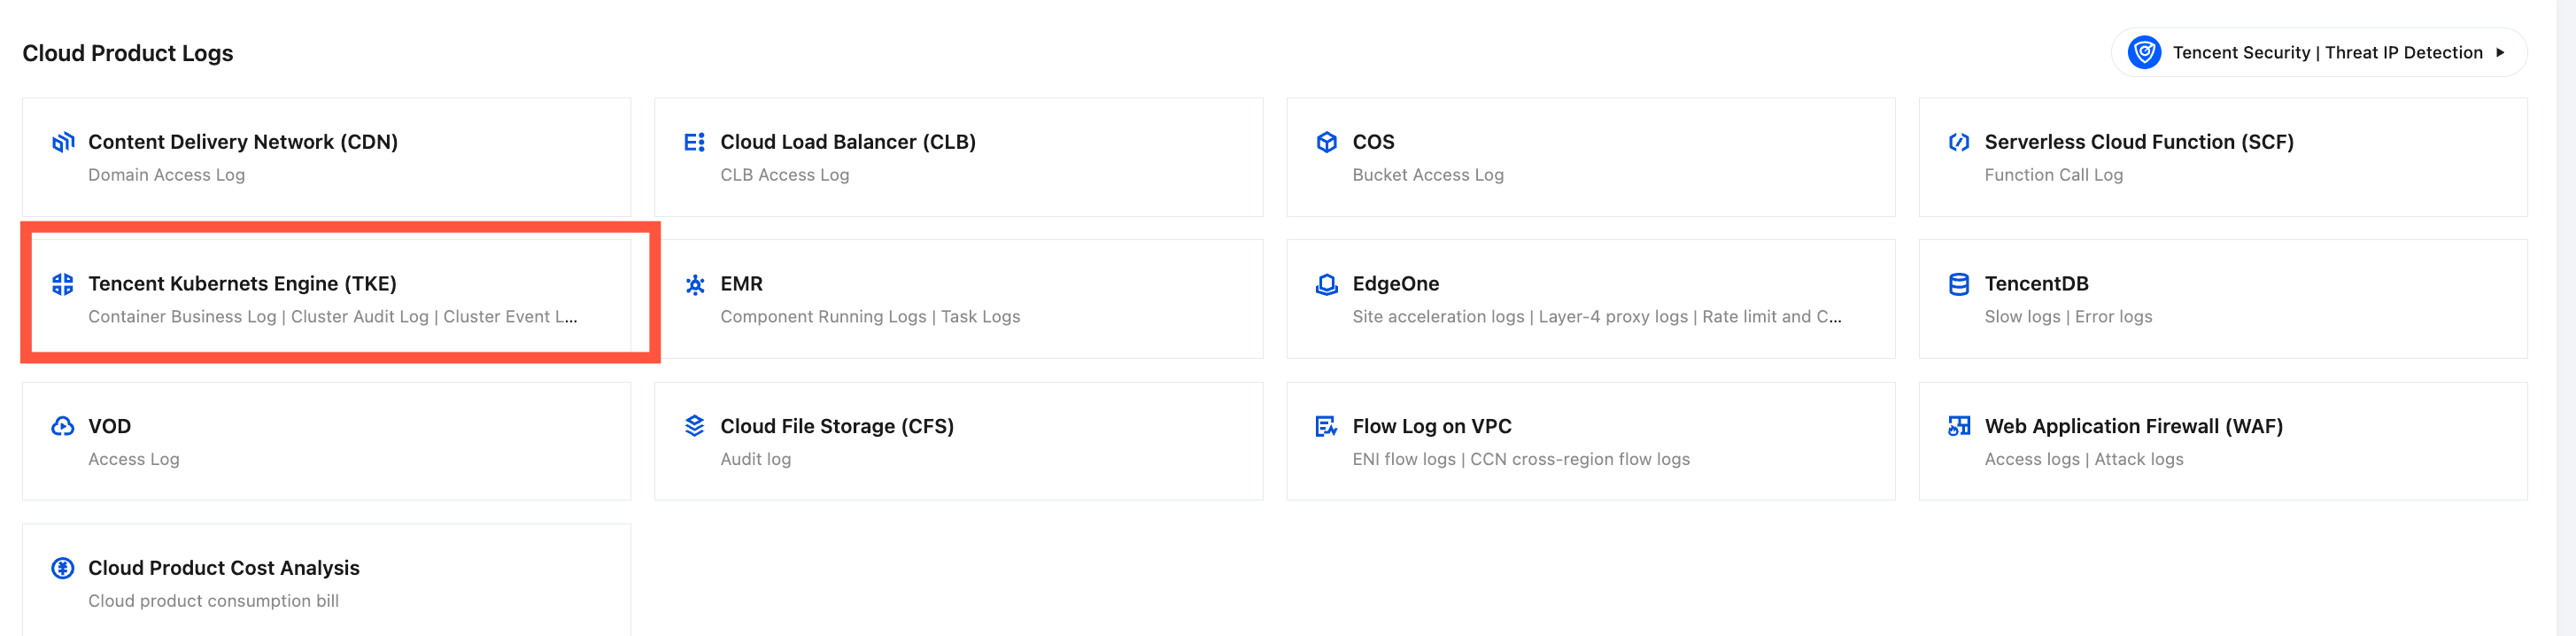
3. In Cloud Product Logs, locate Tencent Kubernets Engine(TKE) and click to go to the Tencent Kubernets Engine(TKE) Cloud Insight page.
Step 2: Enable TKE Cluster Audit Log Collection
1. In the TKE Cloud Insight, locate the target cluster in the cluster list. If the status of the collection component is Not Installed, click Install to install the log collection component.
Note:
If the log collection component is installed in a cluster, a Pod named tke-log-agent and a pod named cls-provisioner will be deployed in the form of DaemonSet in the kube-system namespace of the cluster. Reserve at least 0.1 cores and 16 MiB of available resources for each node.
2. If the status of the collection component is Latest, click the cluster name to go to the cluster details page, and then locate Cluster Audit Logs on the cluster details page.
3. Click Enable Cluster Audit Logs to go to the Cluster Audit Logs Configuration Process.
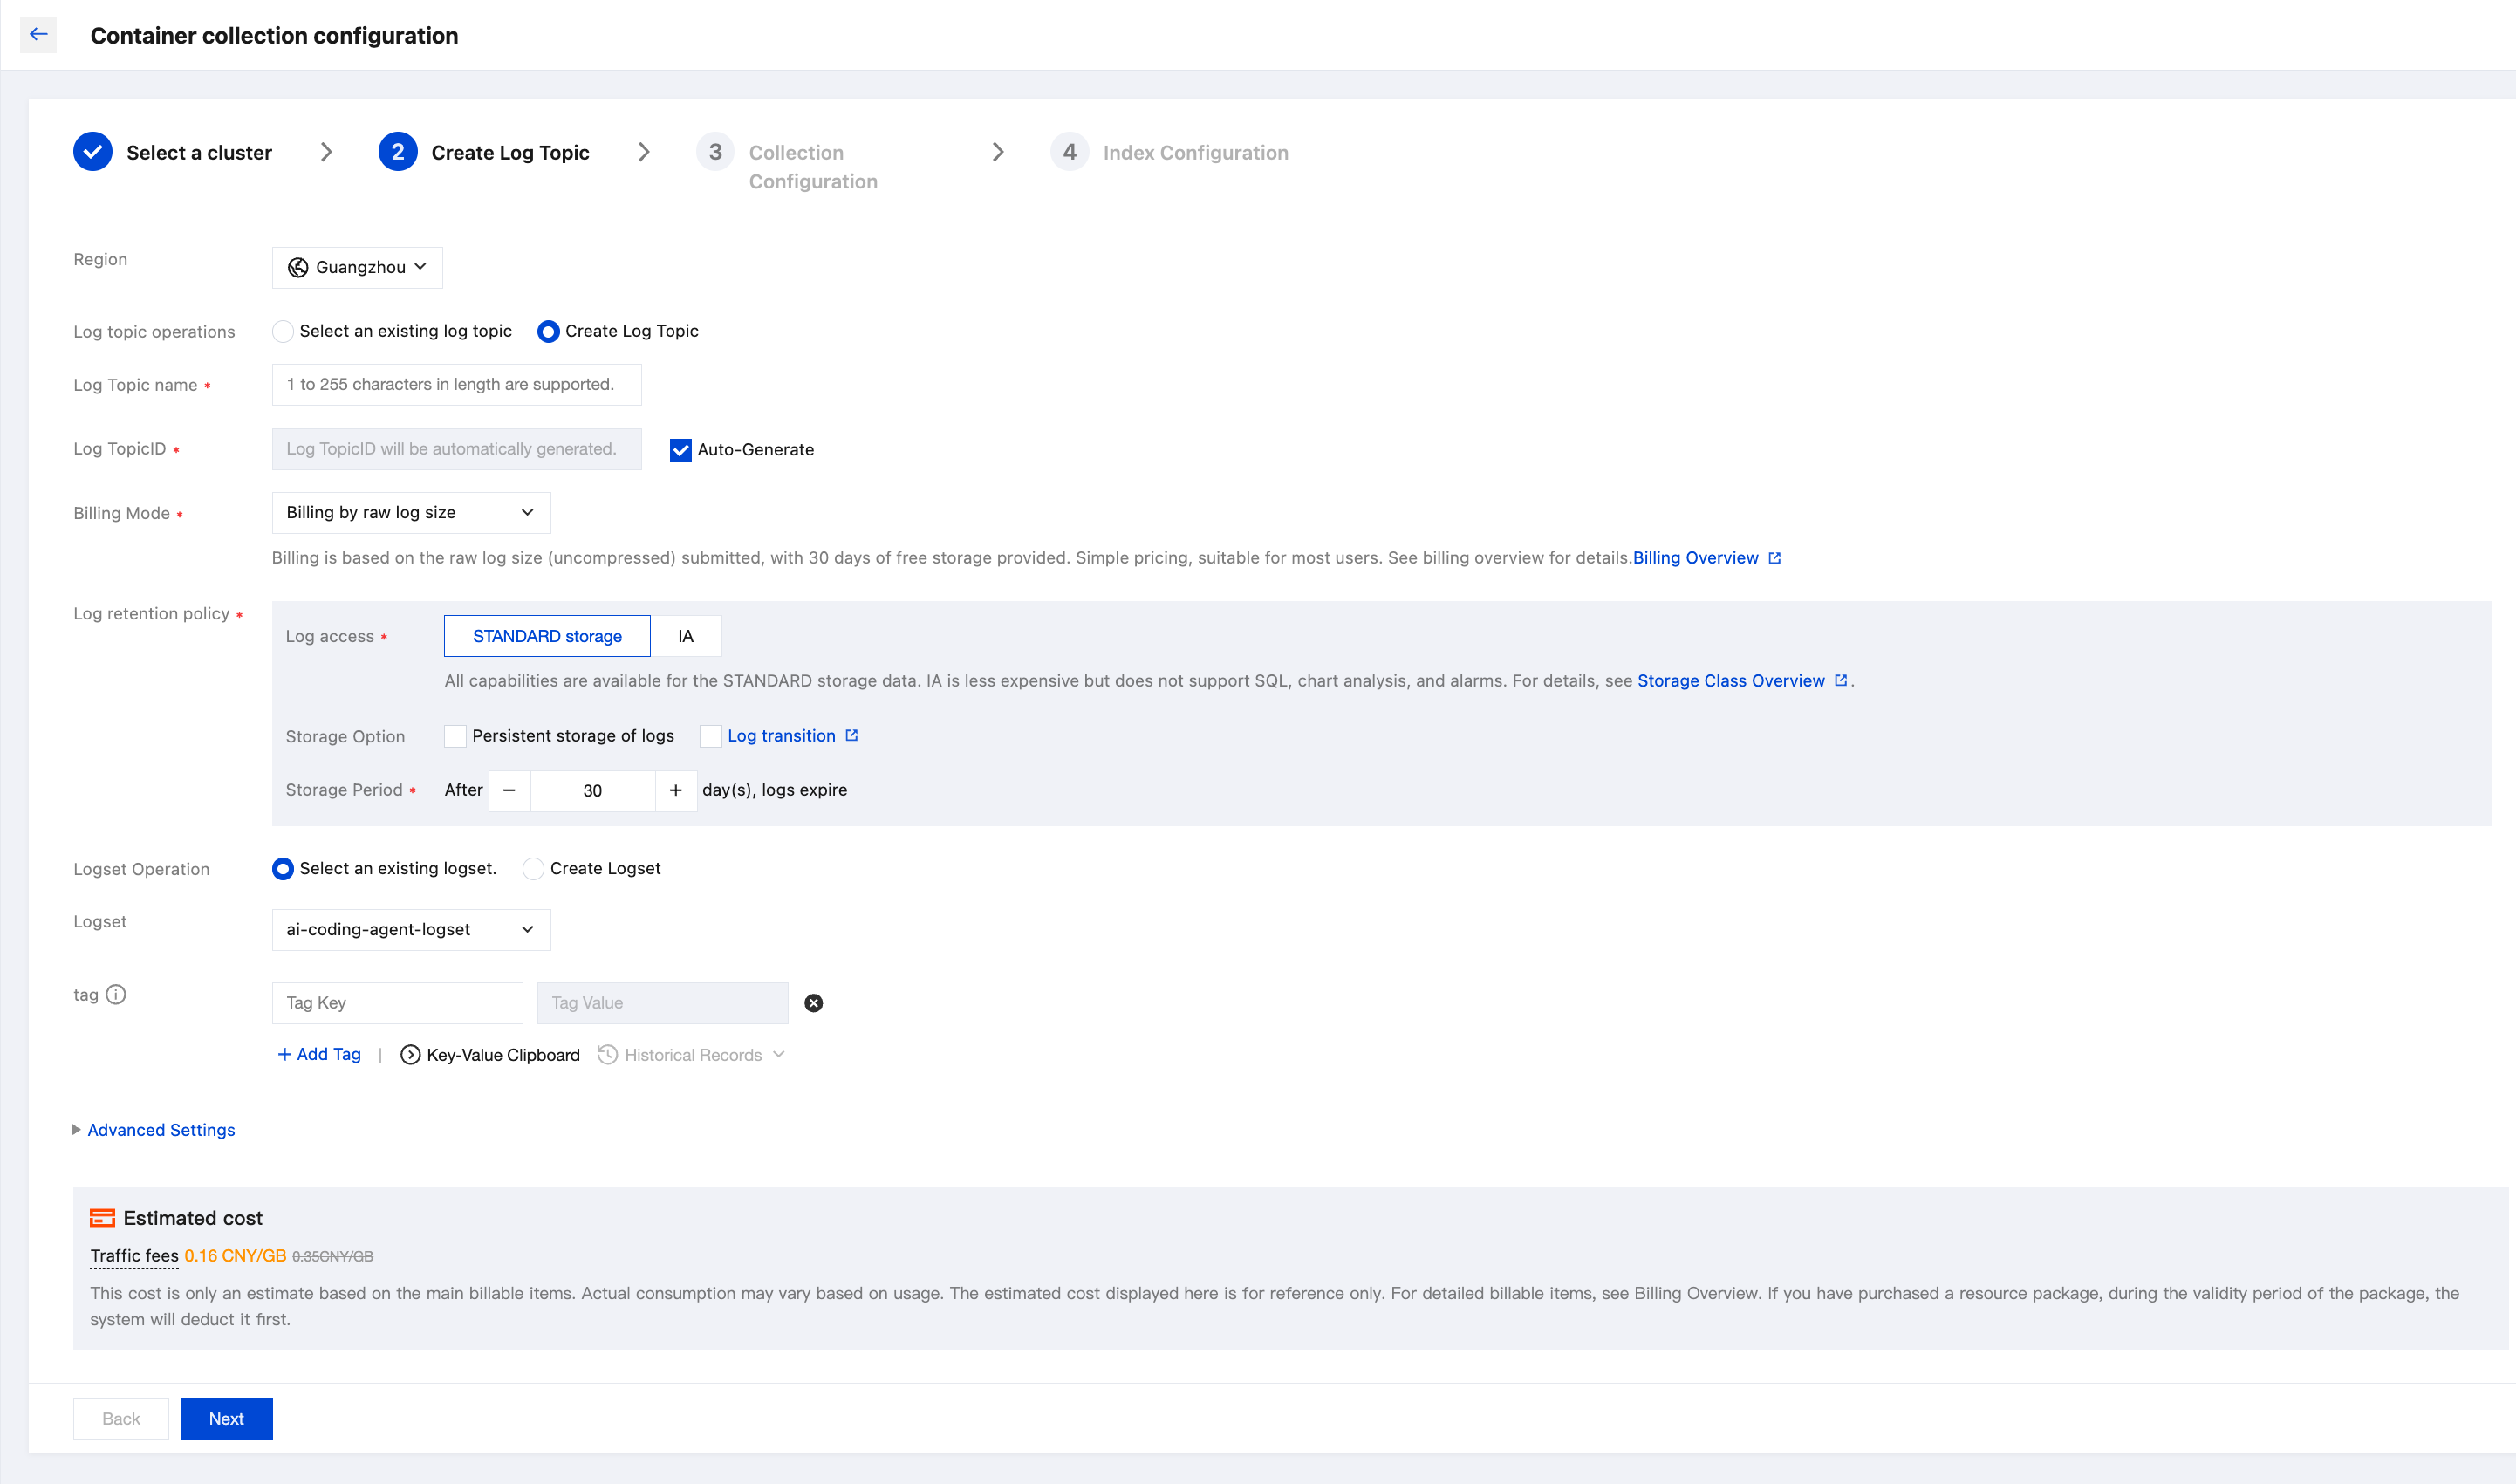
4. Go to the audit log configuration process. In the Log Topic Configuration step, you can select an existing log topic or create a new one for storing logs. For information about log topics, see Log Topic.
5. After completing the log topic configuration, click Next to go to Index Configuration. For information about indexes, see Index.
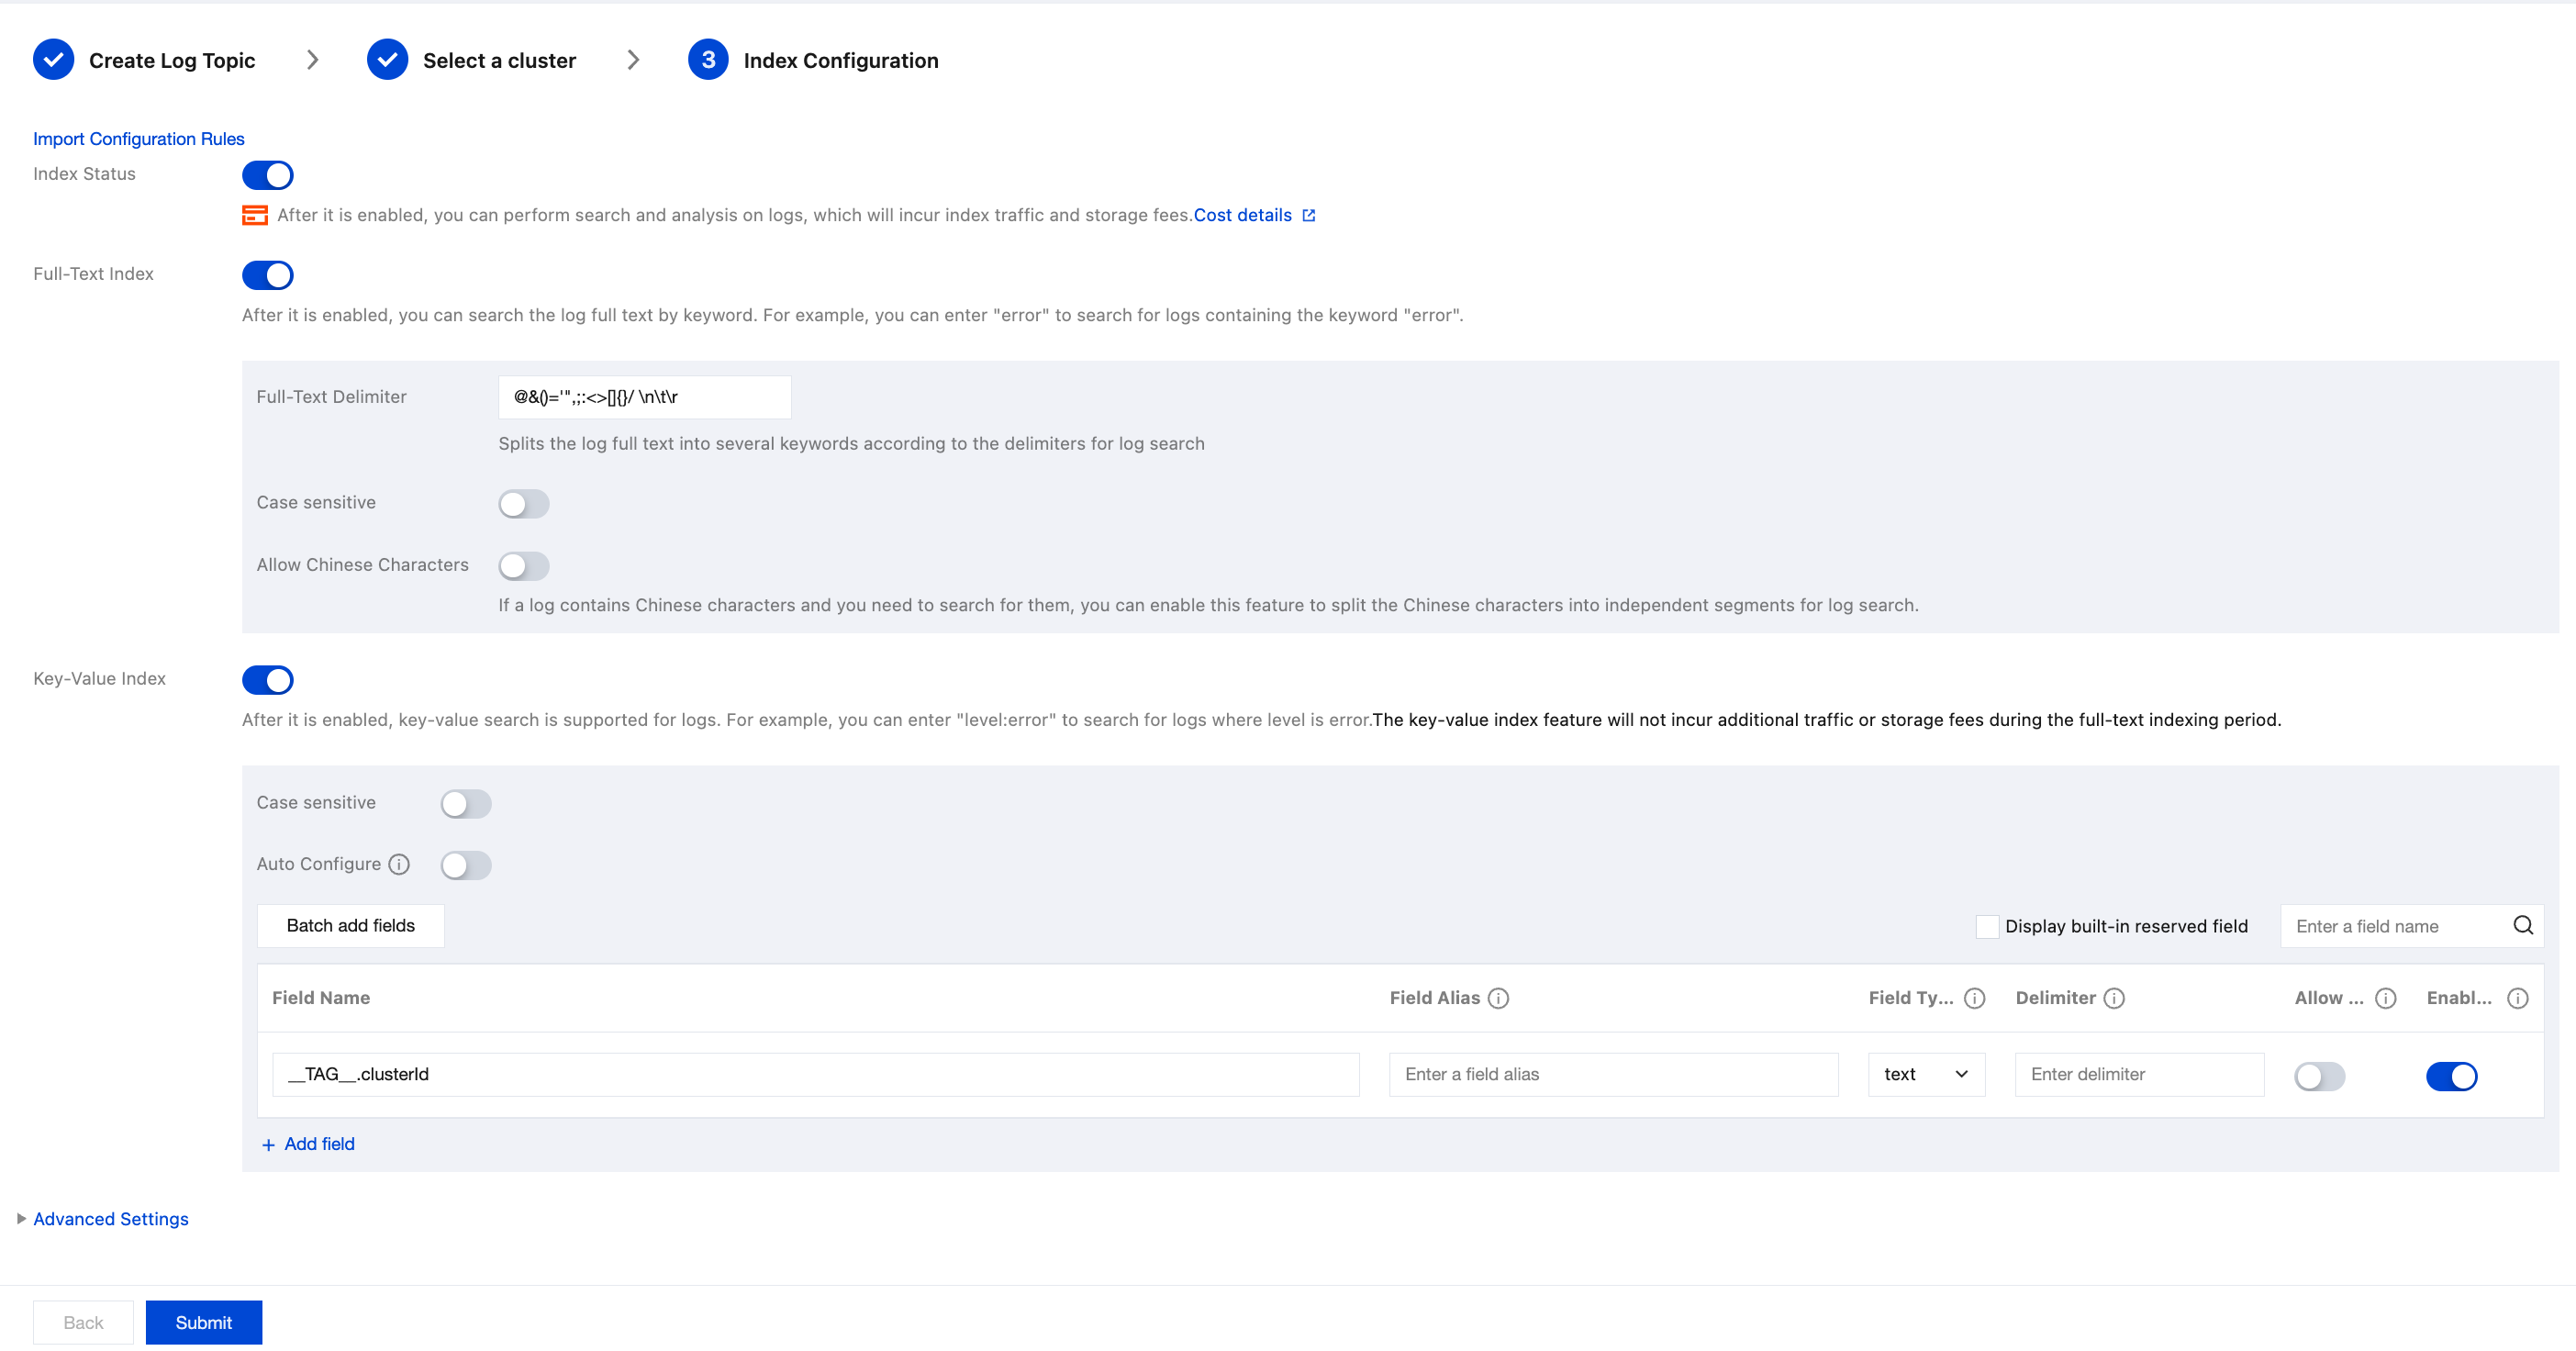
The configuration information in index configuration is as follows:
Index Status: Confirm whether to enable indexing to use analysis features such as log search.
Full-Text Index: Confirm whether to enable case sensitivity. Full-Text Delimiters: The default value is "@&()='\\",;:<>[]{}/ \\n\\t\\r". Confirm whether to modify it.
Allow Chinese Characters: Select whether to enable this feature.
Key-Value Indexing: You can configure the field type, delimiters, and whether to enable statistical analysis as needed based on the key name. If you need to enable key-value indexing, you can turn on the switch.
Note:
Index configuration must be enabled before you can perform searches.
If you need to retrieve logs based on log fields, you need to configure key-value indexes.
If you need to perform statistical analysis based on log fields, you need to configure key-value indexes and enable statistics.
Index rule changes apply only to newly written logs. Existing data is not updated.
Viewing the TKE Audit Analysis Dashboard
After you complete enabling TKE audit log collection, CLS provides four out-of-the-box preset dashboards for the TKE audit scenario.
Audit Overview: Used to observe APIserver operations across the entire cluster.
Node Operation Overview: Used for troubleshooting node-related issues.
K8s Object Operation Overview: Used for troubleshooting issues related to K8s objects, such as a specific workload.
Multi-Dimensional CloudAudit Analysis: Used to observe the distribution trend of cluster operations under a specific dimension.
You can view the above TKE audit pre-configured dashboards by performing the following operations:
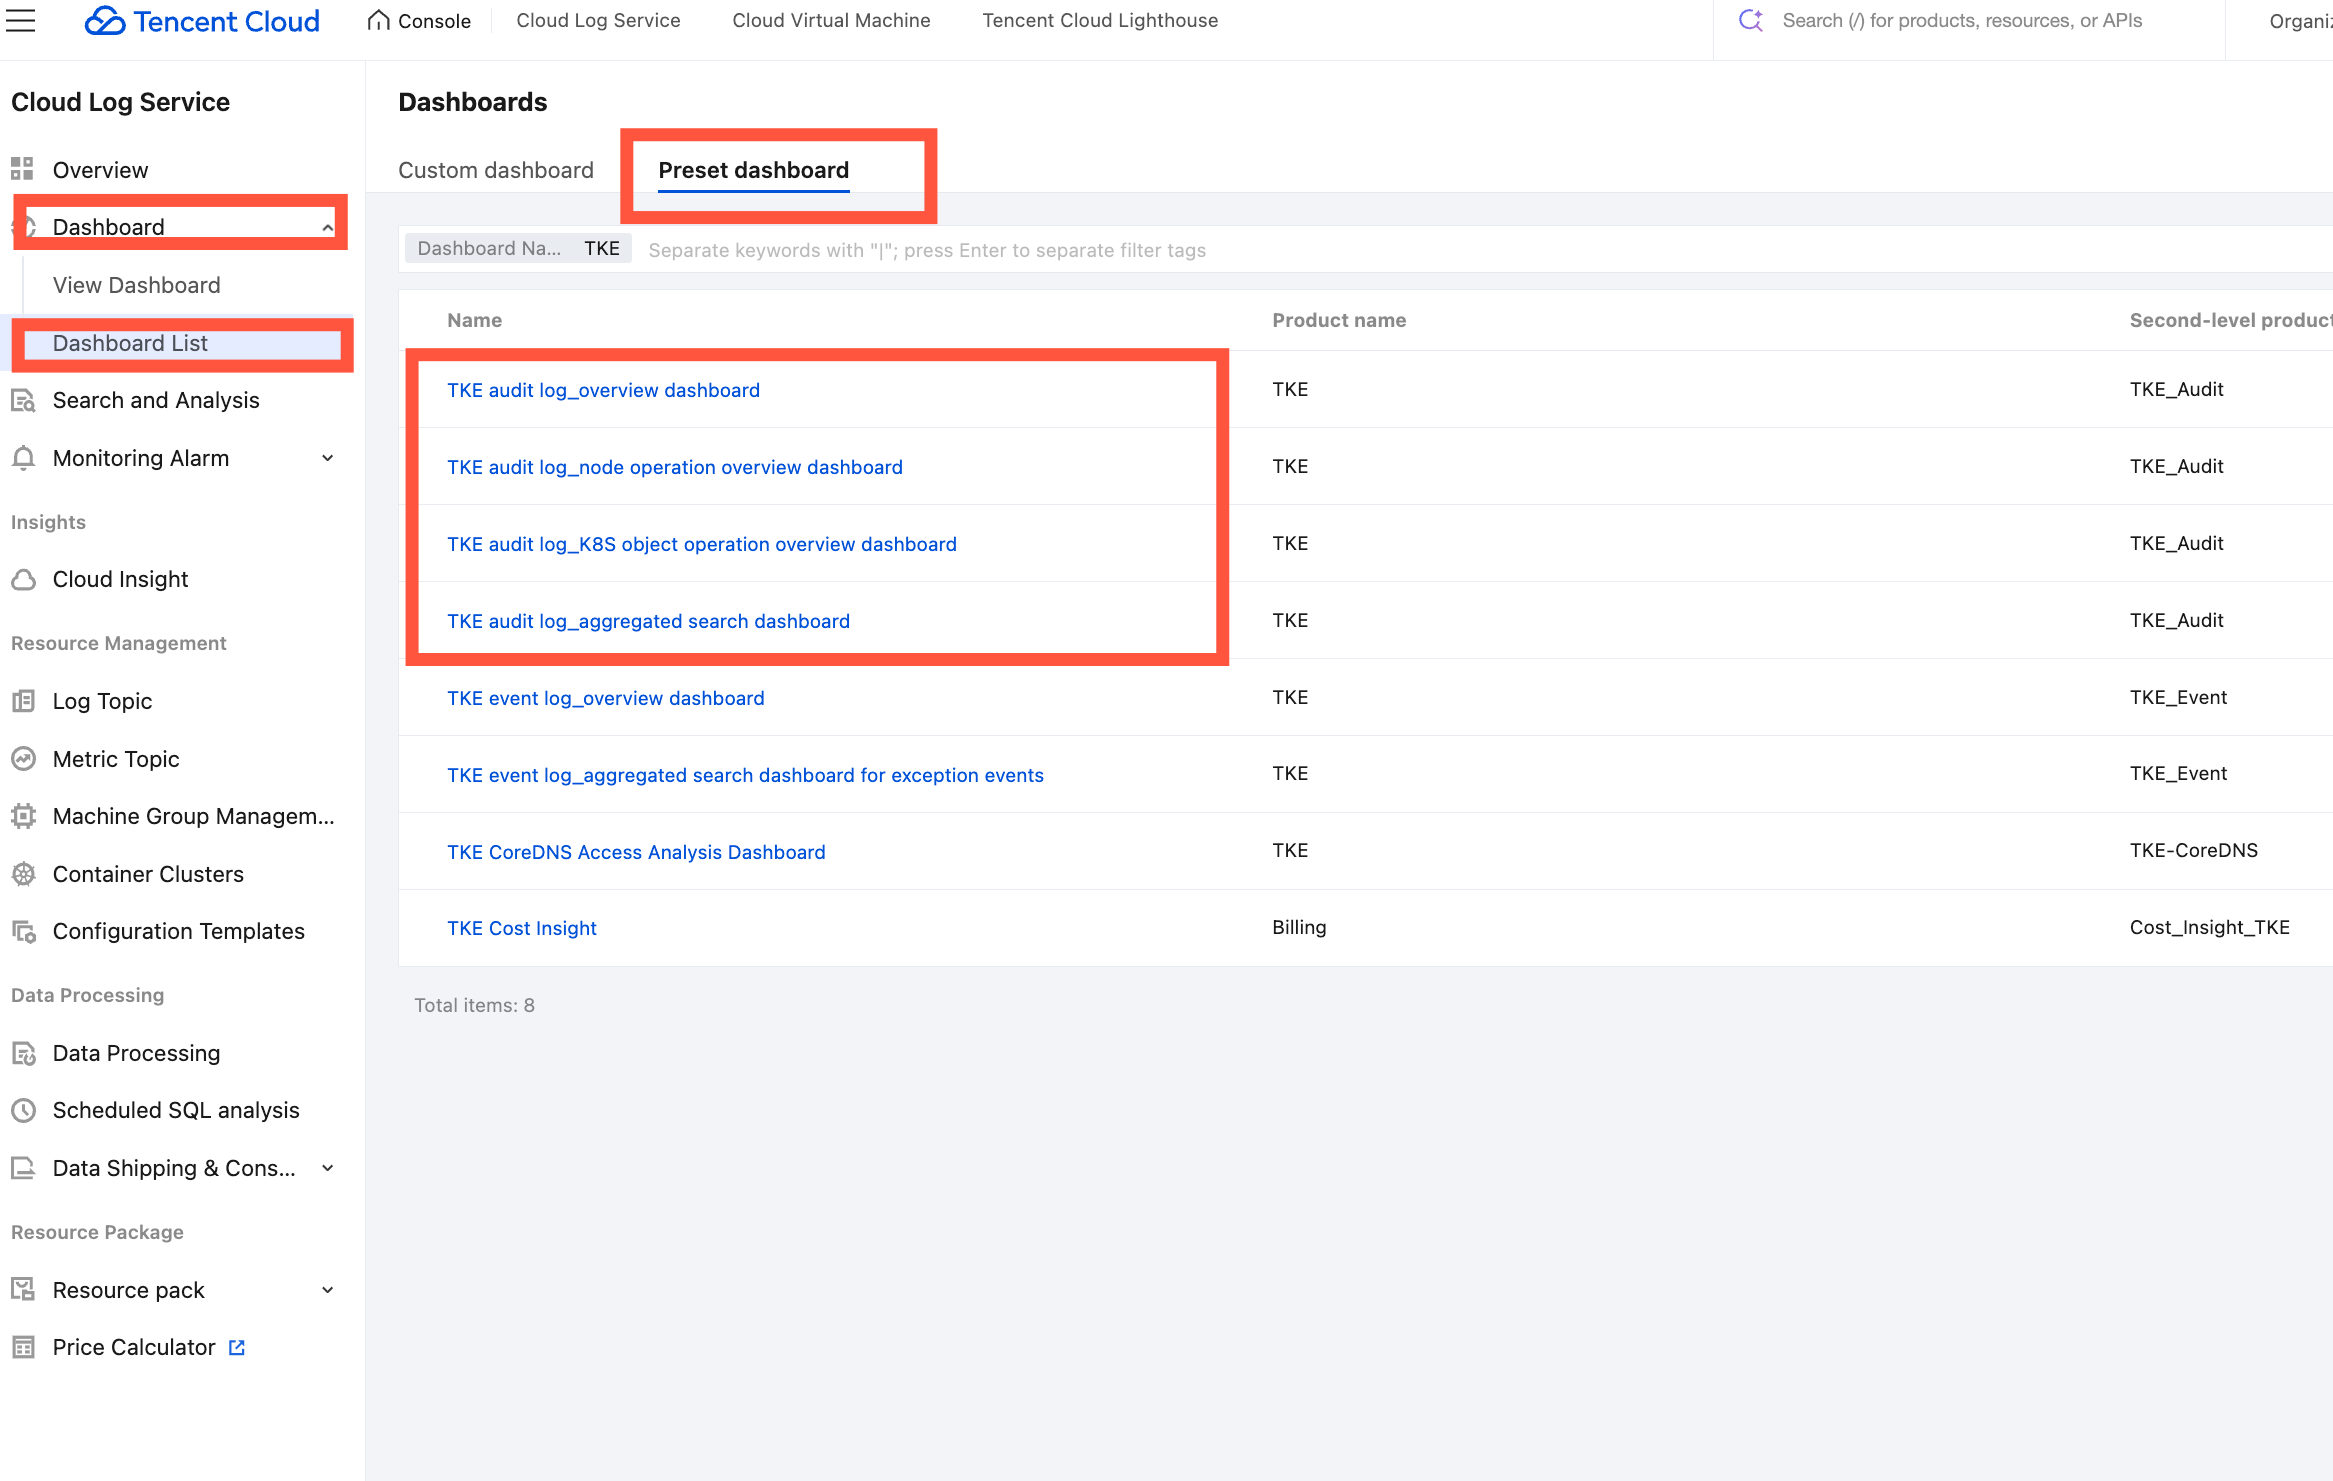
2. In the left sidebar, choose Dashboard > Dashboard List > Preset dashboards, and search for "TKE".
Searching and Analyzing Cluster Audit Logs
1. After you complete enabling TKE audit log collection, locate the cluster for which cluster audit logging is enabled in the cluster list, and click the cluster name to go to the cluster details page.
2. On the cluster details page, click Log Management and locate the cluster audit logs module.
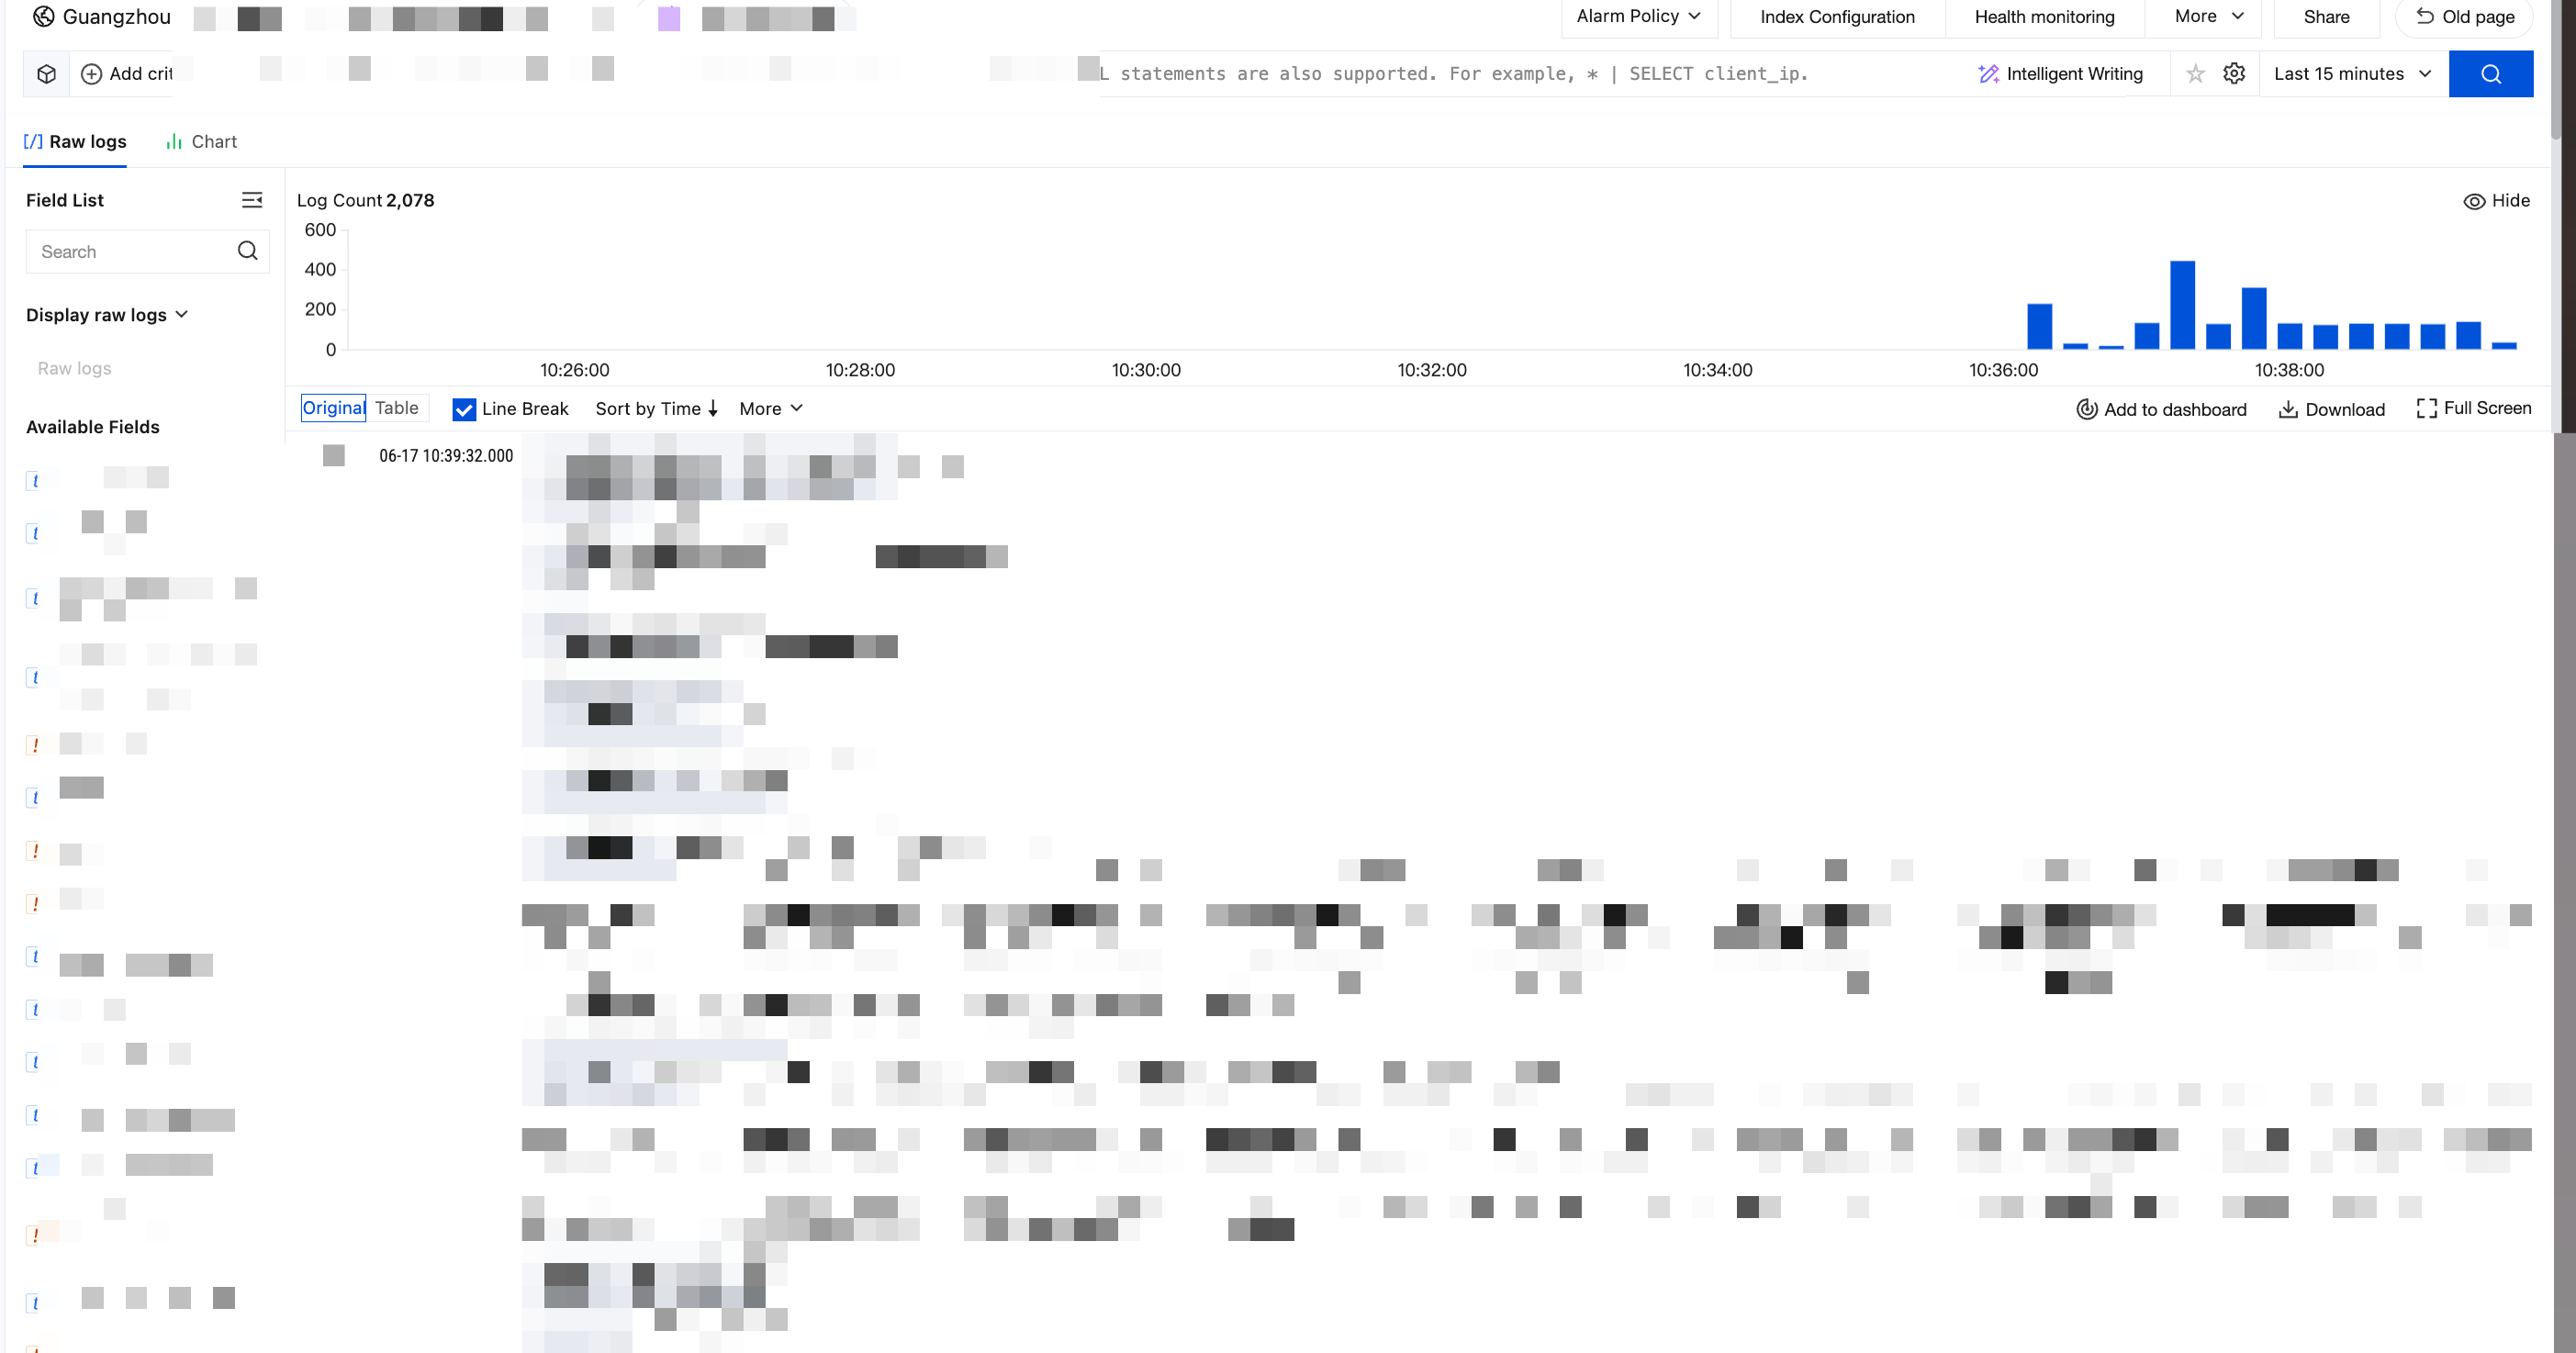
3. Click Audit Logs to go to the log search page, where you can search and analyze the target cluster's audit logs. For log field descriptions, see Log Field Descriptions.
Audit Log Fields
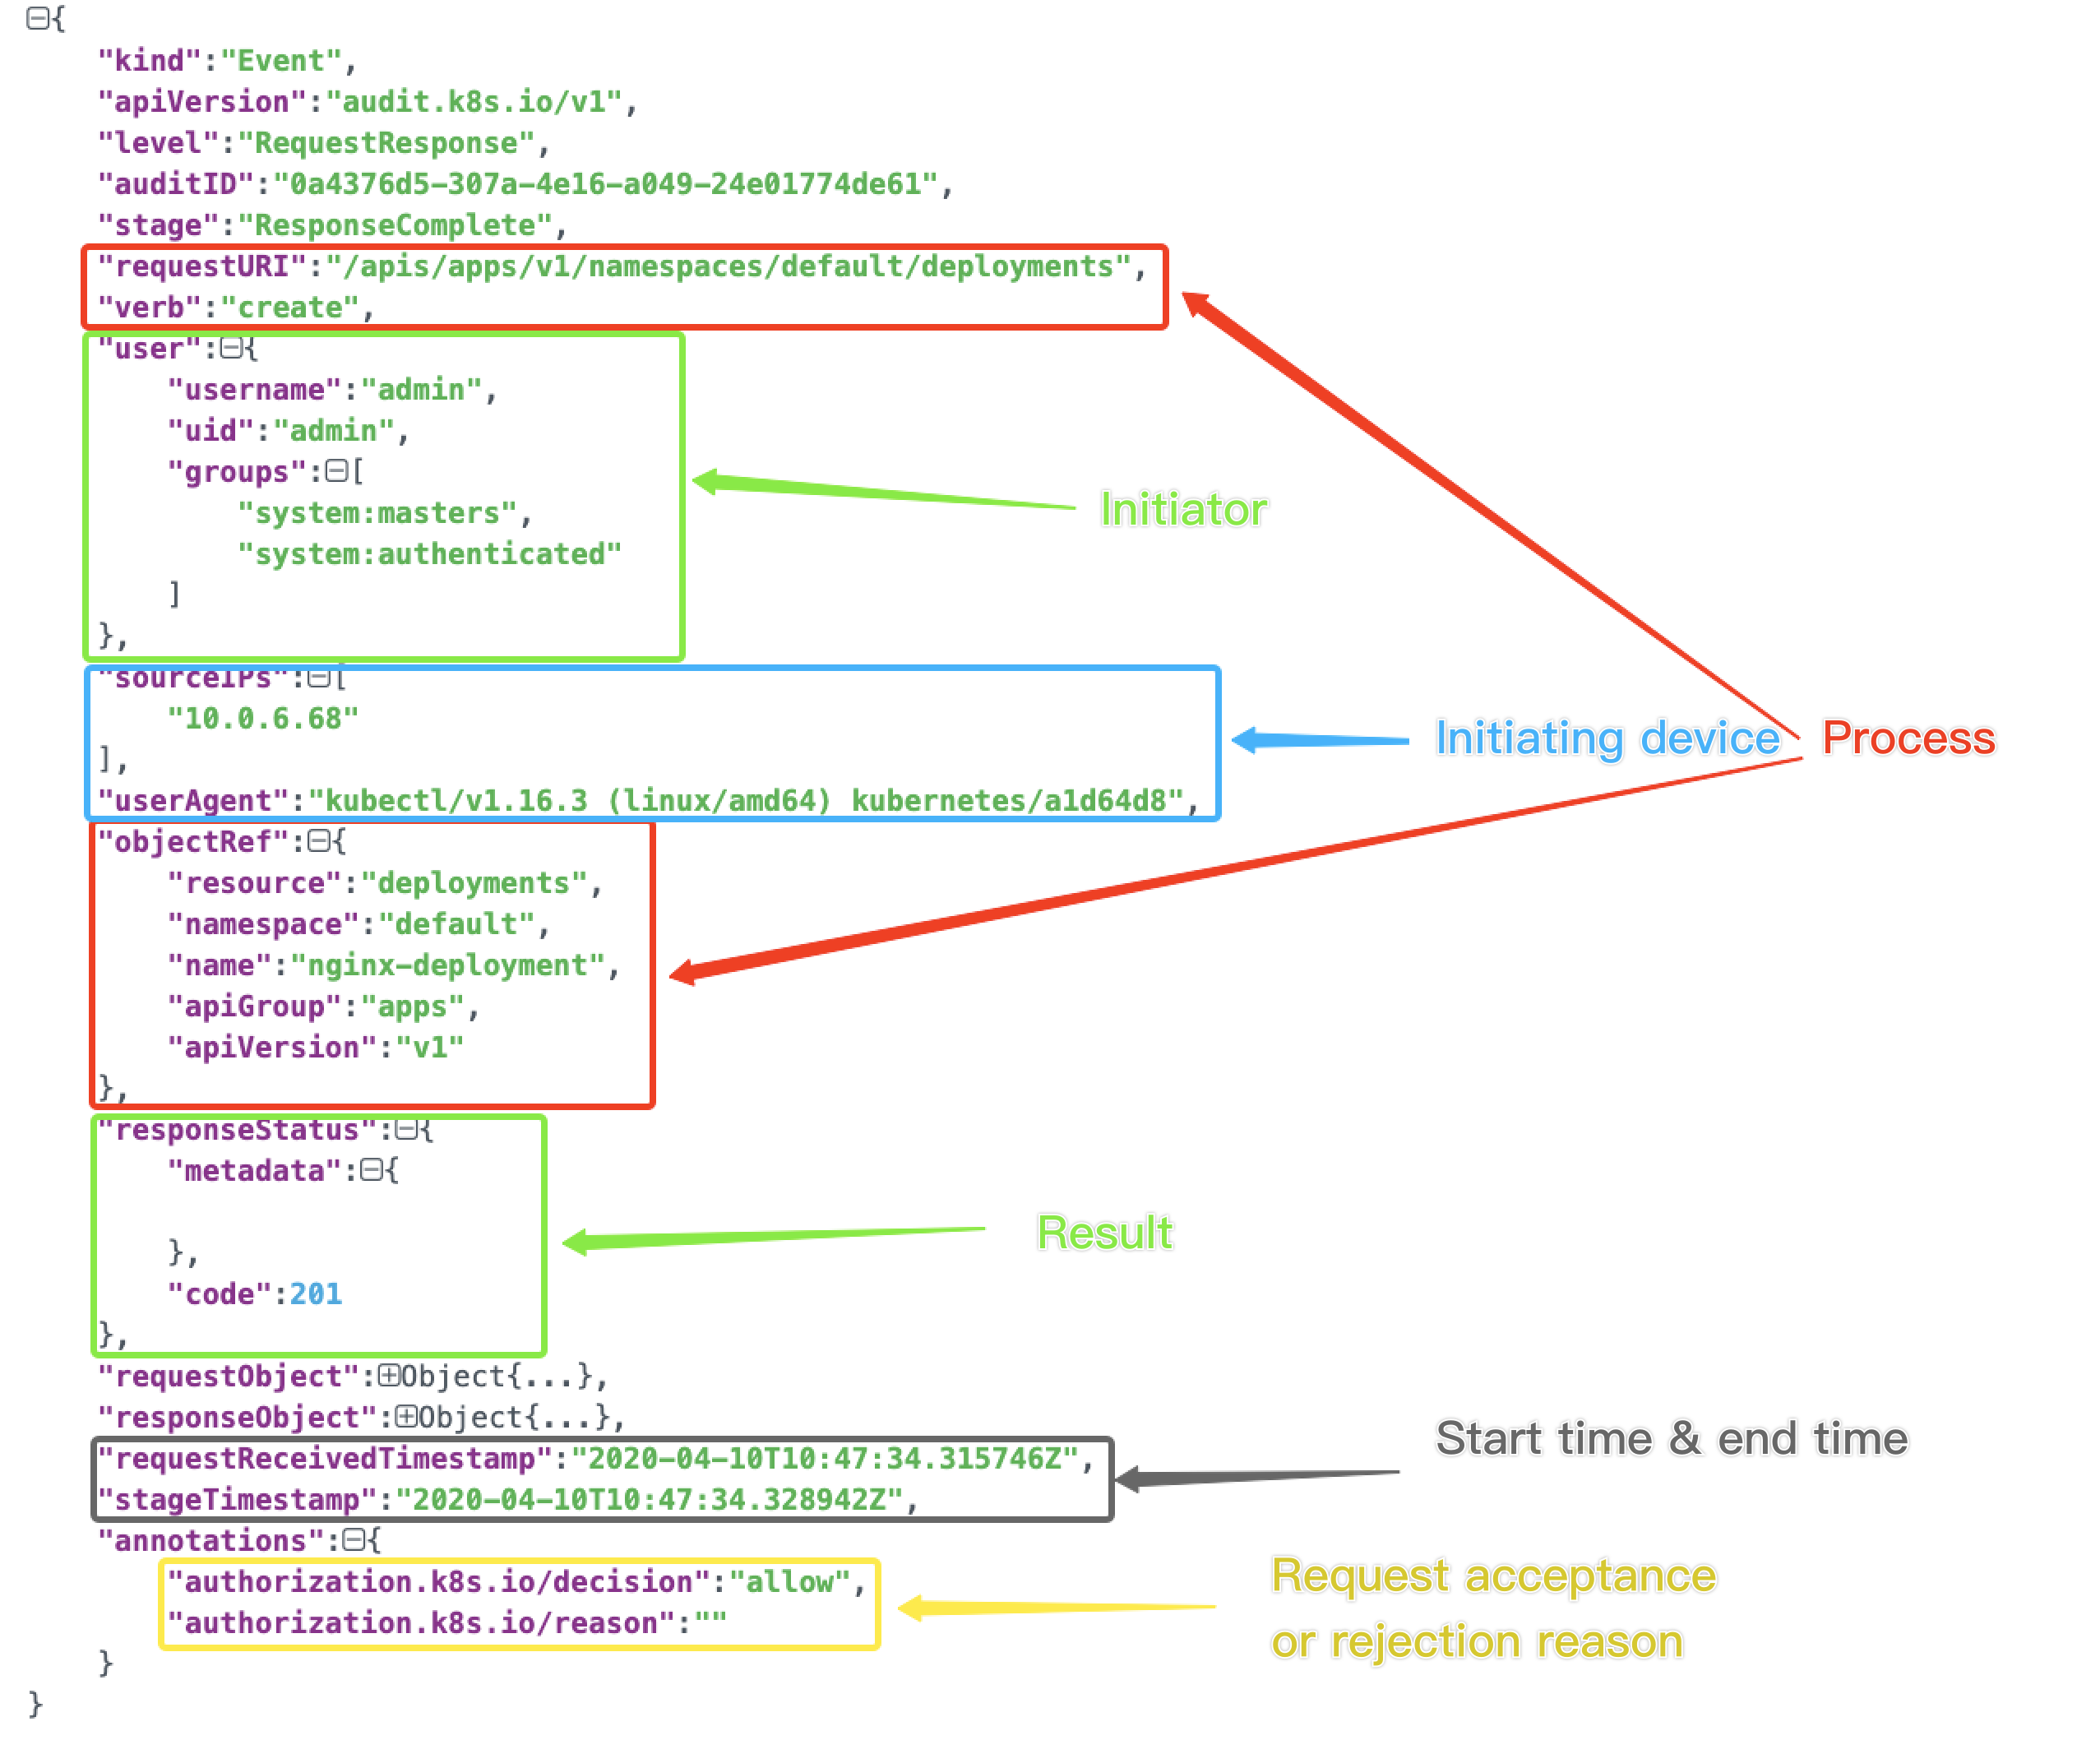
Each audit log is a structured record in JSON format, and includes three parts: metadata, requestObject, and responseObject. The metadata is a required part (it contains the request context information, such as who initiated the request, where it was initiated, and the accessed URI). requestObject and responseObject are optional, depending on the audit level.
Activities that occur within a cluster.
The time when an activity occurs and the object involved.
The trigger time, trigger location, and observation point of an activity.
The result of an activity and the subsequent handling actions.
Scenario 1: An application in the cluster was deleted. Who did it?
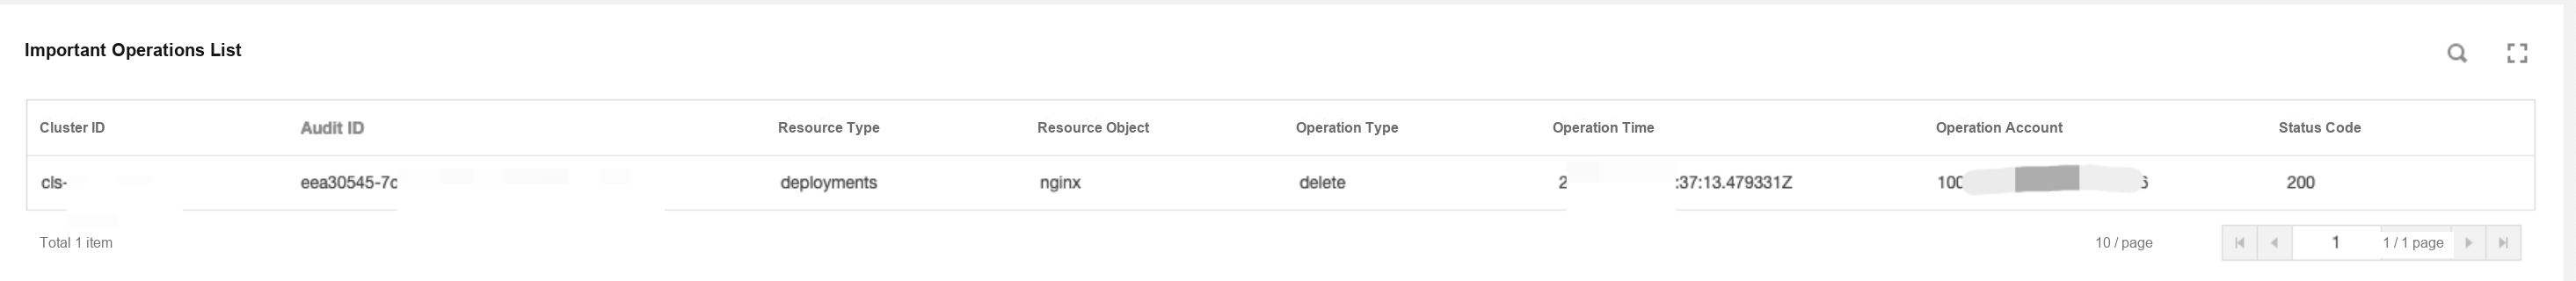
1. On the Auditing Search page, click the K8s Object Operation Overview tab and specify the operation type as delete and specify the resource object nginx.
The following figure shows an example of the query result.
As shown in the above figure, account 10001****7138 deleted the NGINX application. You can use the account ID to query the detailed information about this account in CAM > User List.
Scenario 2: The load of apiserver suddenly becomes high and a large number of access failures occur. What happened in the cluster?
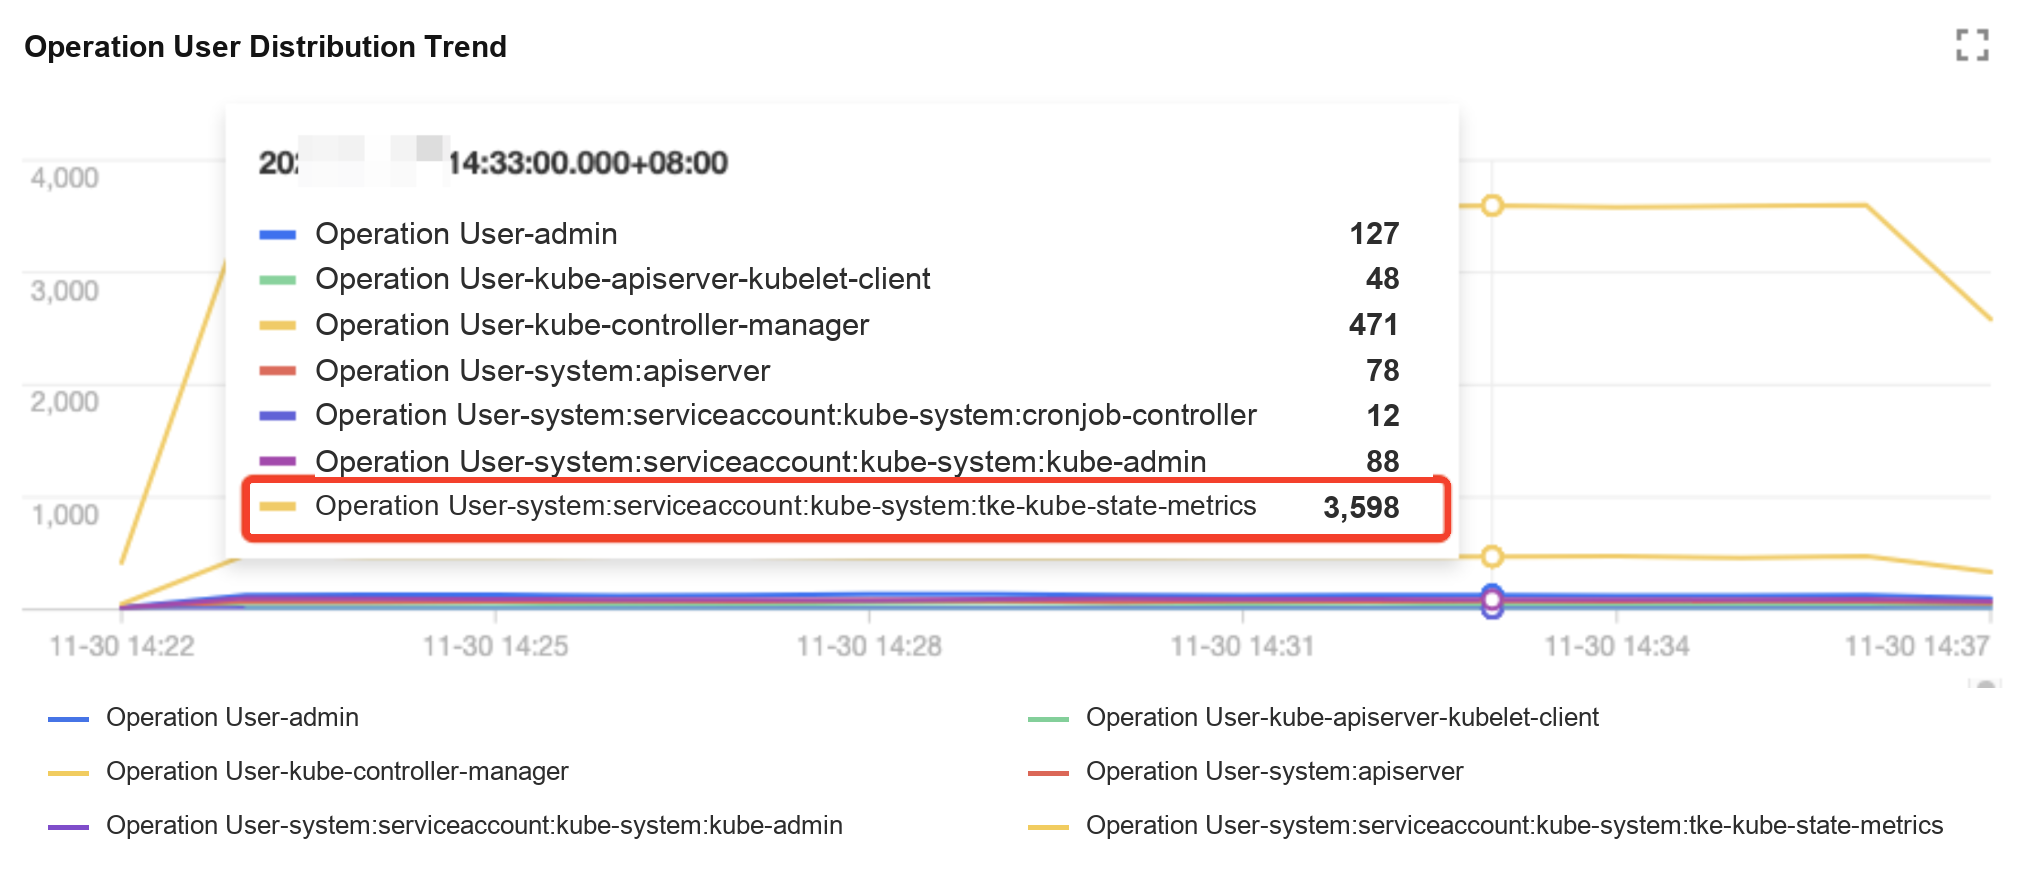
1. On the Auditing Search page, click the Aggregation Search tab. The tab page displays the trend of apiserver access in multiple dimensions such as user, operation type, and status code.
Operation User Distribution Trend:
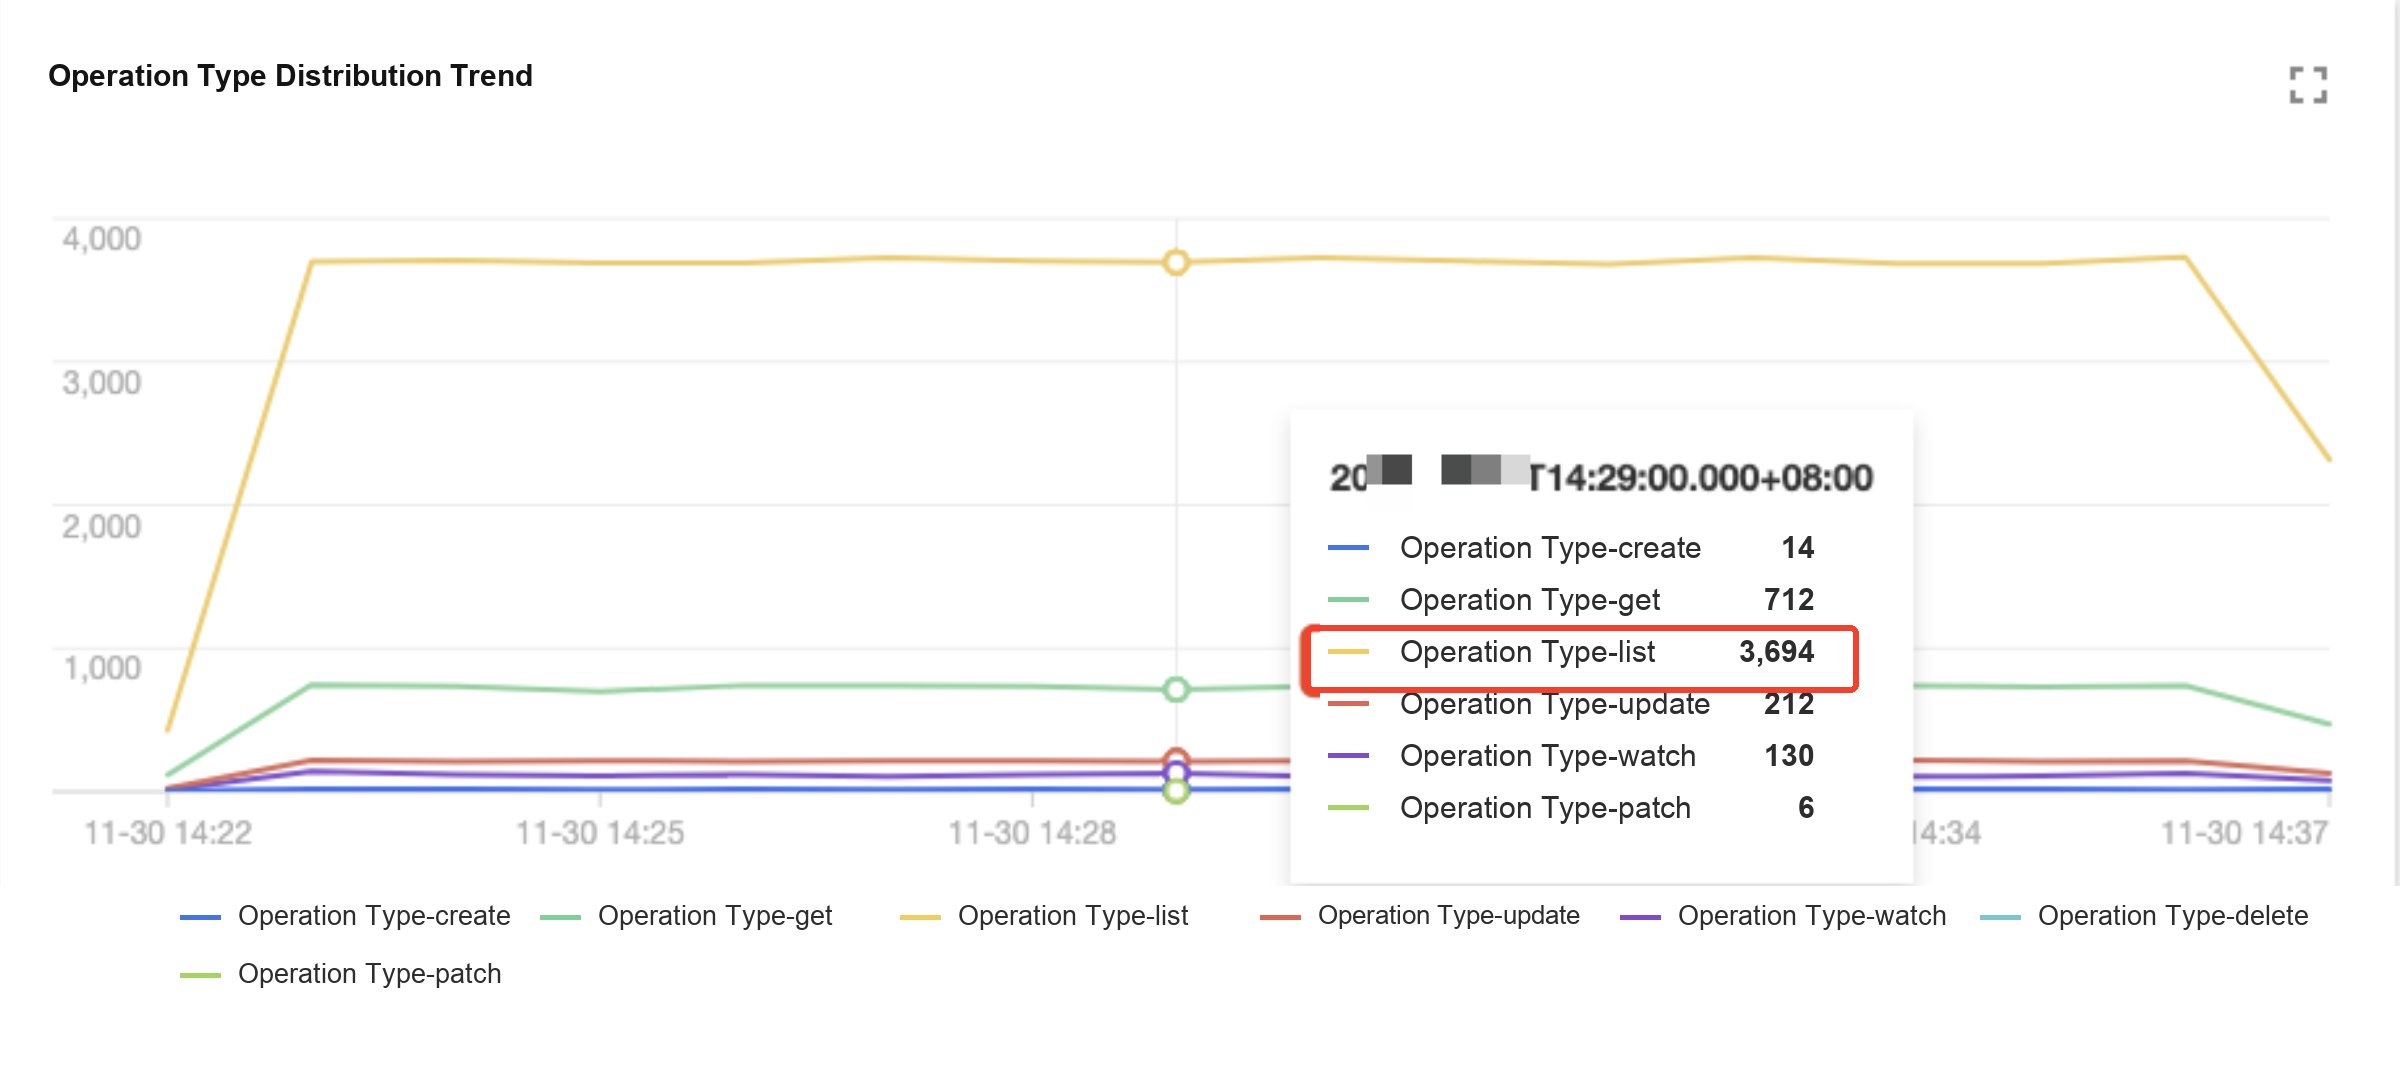
Operation Type Distribution Trend:
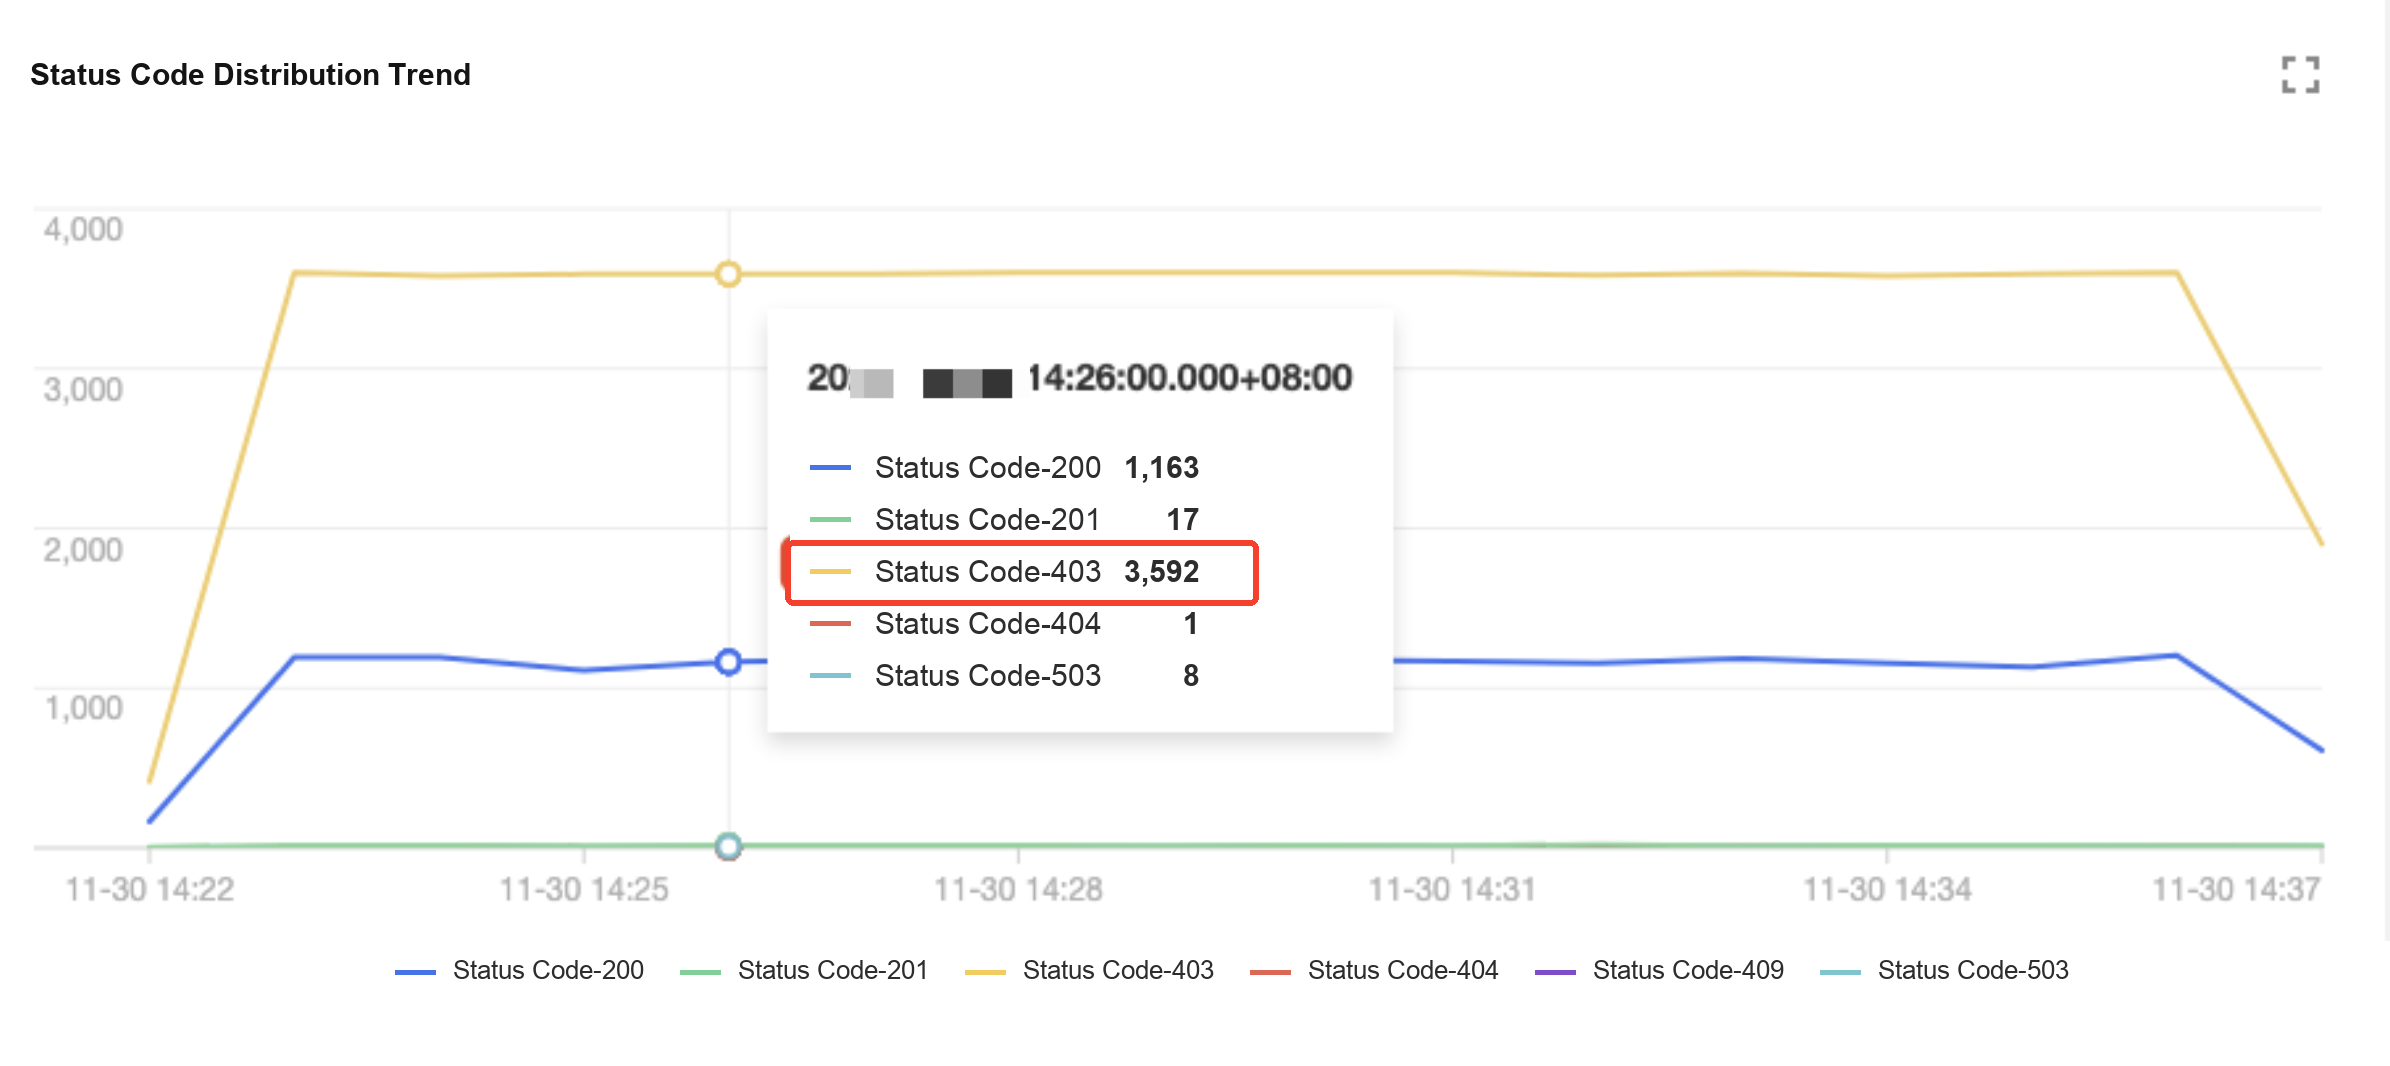
Status Code Distribution Trend:
As shown in the above figures, you can find that user tke-kube-state-metrics has the maximum number of accesses; in the Trend of Operation Type Distribution chart, most operations are list operations; and in the Trend of Status Code Distribution chart, most return codes are 403. Then use the tke-kube-state-metrics keyword to search for logs.
Scenario 3: Cluster nodes are cordoned off. Who did it and when did it happen?
1. On the Auditing Search page, click the Node Operation Overview tab, and enter the name of the cordoned node on the tab page.
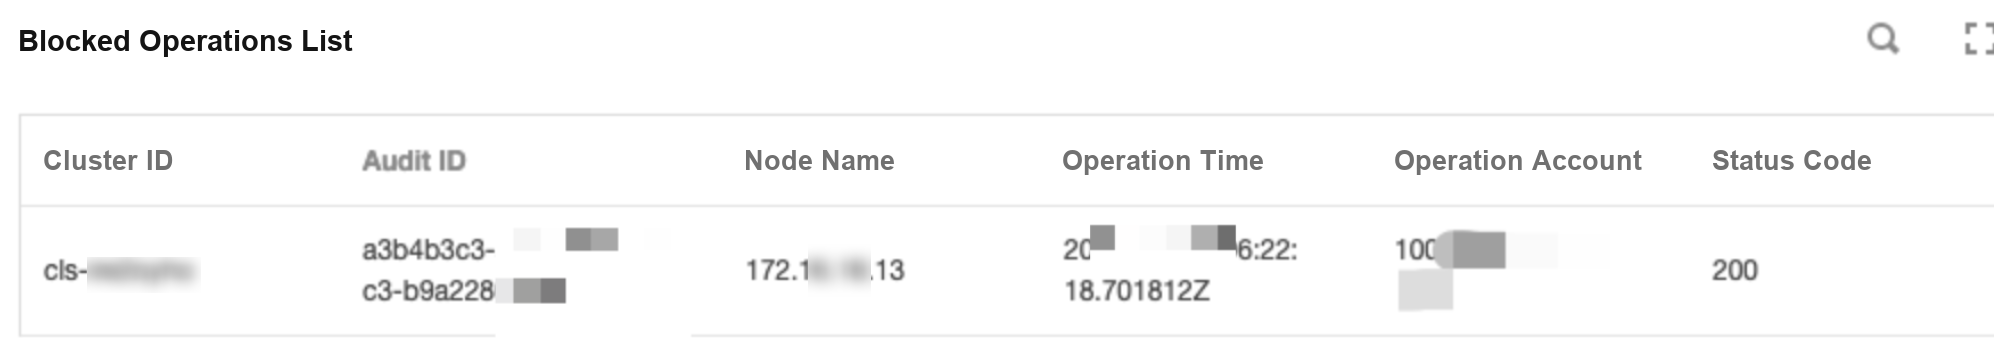
2. The following figure shows an example of the query result.
As shown in the above figure, account 10001****7138 cordoned off the node 172.16.18.13 at 2020-11-30T06:22:18.