In data analysis scenarios, data can be aggregated using various calculation criteria, such as sum, count, and average. This document introduces aggregation from the perspectives of dimensions and metrics as follows:
Dimension Aggregation
Currently, the aggregation of time-type fields is supported. Below is an example of "product sales analysis" with 4 raw data entries to demonstrate the use case and usage method:
id
Product
Time
Amount
1
Tissue
2022-01-02 12:10:23
10
2
Towel
2022-01-01 09:50:13
3
3
Tissue
2022-01-01 08:32:41
10
4
Water
2022-01-01 08:32:09
1
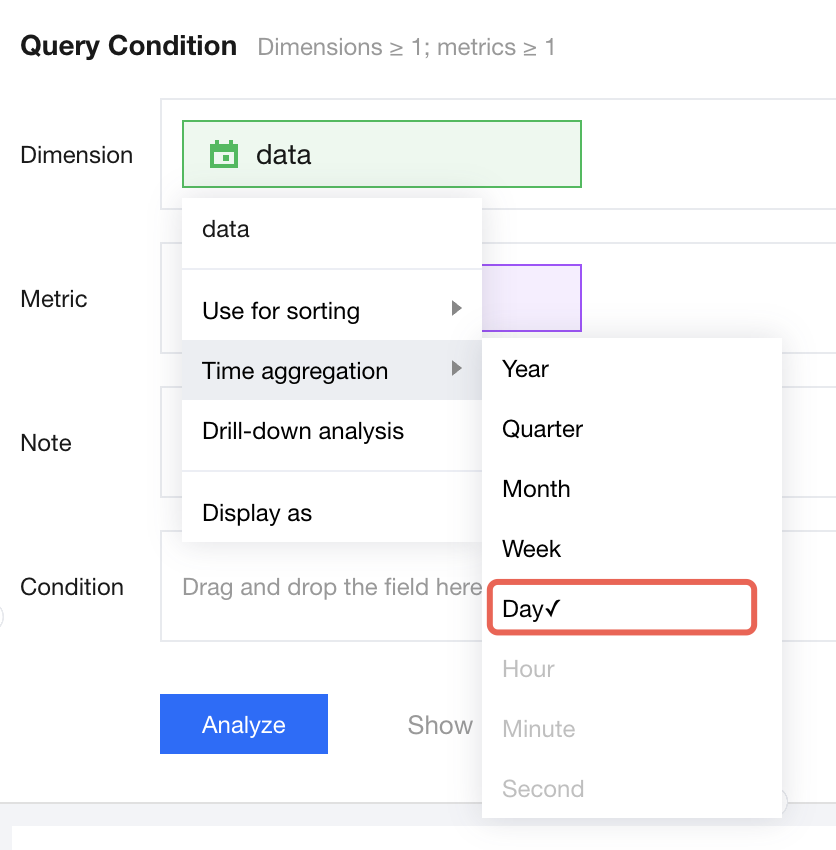
To obtain sales for January 1, 2022, aggregate the "time" dimension to "day". In the system, first drag and drop the "time" field into the "Dimension" box, as follows:
After aggregating the "time" dimension to "day", sum the amounts for January 1, 2022, as 3+10+1 = 14;
After aggregating the "time" dimension to "hour", sum the amounts for 08:00 on January 1, 2022, as 10+1 = 11.
Likewise, to get weekly statistics, just set the time aggregation to "week".
In the time aggregation settings, pay attention to the following:
1. The granularity of time aggregation is determined by the time field format. You can view and edit the time format in the data table.
2. The time field format determines the highest accuracy. By default, aggregation is performed at the highest accuracy. The granularity for aggregation should be at or above the highest accuracy. For example, if the time field format is accurate to the second, you can aggregate data by "year, month, week, day, hour, minute, or second". If the time field format is accurate to the day, you can only aggregate data by "year, month, week, or day".
Metric Aggregation
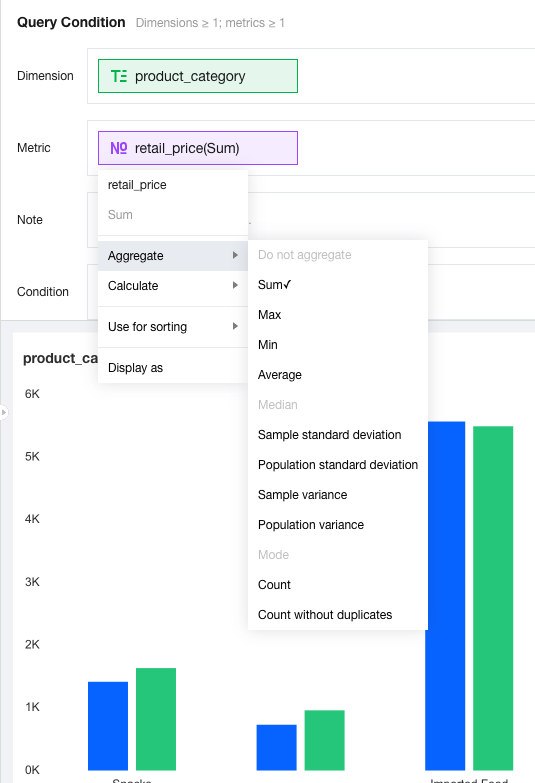
Any field set as a metric will be numerically aggregated.
If this field is a numeric field, the following aggregation can be performed:
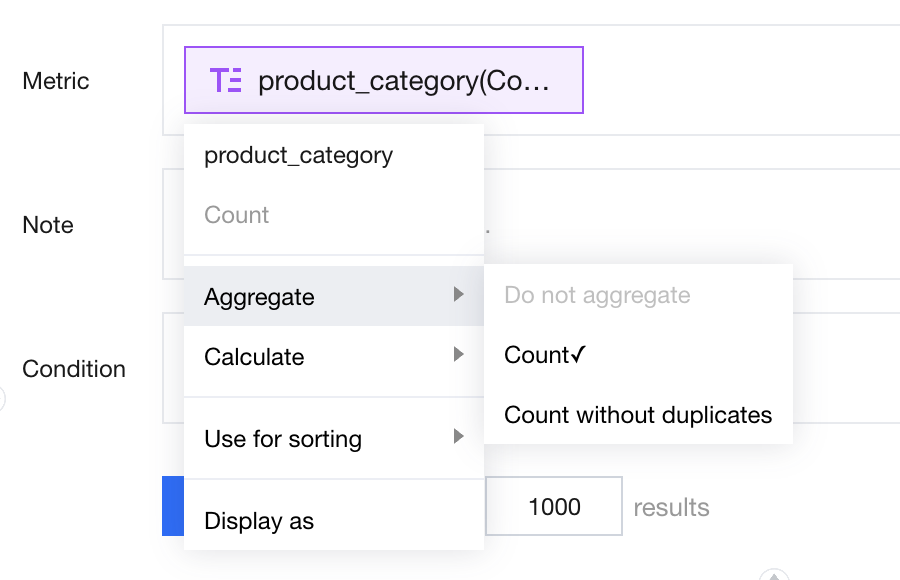
If this field is not a numeric field, the following aggregation can be performed:
The following explains the statistical criteria for different aggregation methods one by one:
Sample data table fragment:
id
Product
Time
Amount
1
Tissue
2022-01-02 12:10:23
10
2
Towel
2022-01-01 09:50:13
3
3
Towel
2022-01-01 08:32:41
10
4
Water
2022-01-01 08:32:09
1
5
Water
2022-01-01 08:32:08
1
Aggregation statistics are as follows: (The dimension field is "time" and the metric field is "amount". The "amount" calculation for January 1, 2022, is taken as an example.)
Aggregation Method
Aggregation Description
Example
No aggregation
Get the value of the first record
The result is 1 (Amount of ID: 5, which needs to be viewed combined with the sorting order)
Sum
Sum all numeric values
The result is 3+10+1+1 = 15
Maximum value
Get the maximum value from all records
The result is 10 (Amount of ID: 3)
Minimum value
Get the minimum value from all records
The result is 1 (Amount of ID: 4)
Average value
Get the sum of all record values divided by the number of records
The result is (3+10+1+1)/4 = 3.75
Count
Get the number of record occurrences
The result is 4
Count after deduplication
Get the number of unique records
The result is 3 (ID: 4 and ID: 5 have duplicate values)
Median
Get the median value in the current sorting order
The result is 10 (Amount of ID: 3, assuming ID as the dimension and sorting by ID)
Sample standard deviation
Get the sample standard deviation for the current date
The result is 4 (For details, see related mathematical method descriptions)
Population standard deviation
Get the standard deviation of the population for the current date
The result is 4 (For details, see related mathematical method descriptions)
Sample variance
Get the sample variance for the current date
The result is 18 (For details, see related mathematical method descriptions)
Population variance
Get the population variance for the current date
The result is 14 (For details, see related mathematical method descriptions).
Mode
Get the most frequently occurring value for the current date
The result is 10 (For details, see related mathematical method descriptions. The amounts 10 and 1 appear twice each, which need to be viewed combined with the ranking order)
If the dimension field is "time" and the metric field is "product" (non-numeric field), the count of "product" for January 1, 2022, is taken as an example:
Aggregation Method
Aggregation Description
Example
Count
Get the number of record occurrences
The result is 4
Count after deduplication
Get the number of unique records
The result is 2 (ID: 2 and ID: 3, ID: 4 and ID: 5 have duplicate values)
Supplementary description:
The metric aggregation feature depends on the database support. Some databases do not support certain aggregation methods such as mode and variance. To determine whether a specific aggregation method is supported, view the aggregation drop-down list. If the current calculation method is grayed out and unavailable, it means that the method is not supported.